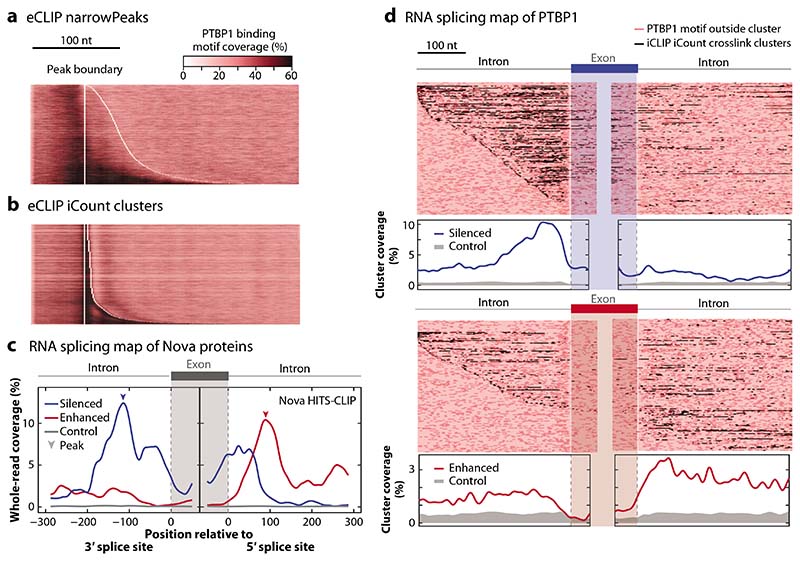
Figure 2.
Visualization of CLIP data: motif plots and RNA maps. (a) The distribution of PTBP1 motifs from Reference 16 are shown around eCLIP peaks that are defined as narrowPeaks and are available from the ENCODE website (https://www.encodeproject.org/). This algorithm relies on the use of whole reads, which leads to misalignment of motifs and peaks. (b) The iCount peak caller (15) uses the starts of aligned reads to define the crosslink positions and peaks, leading to good overlap with PTBP1 motifs. (c) Integrating CLIP and orthogonal data allows further exploration of data quality using an RNA splicing map, which examines the distribution of clusters of assigned binding sites around silenced (blue) and enhanced (red) exons. This approach was first used with HITS-CLIP reads for Nova in mouse brain (11). In this panel, we assign a binding site to all positions in transcripts that overlap with at least one raw read, based on the 168,632 reads obtained by the original HITS-CLIP publication (11); even though we do not use peak calling, this results in high position-dependent enrichment that agrees well with the computationally derived RNA map (10), thus highlighting the high specificity of raw CLIP data. (d) An RNA splicing map of PTBP1 iCLIP data from HeLa cells (16) is drawn in two ways, with peaks called using iCount with 3-nt clustering (15). Regulated exons are defined using microarray data upon knockdown of PTBP1/PTBP2 in HeLa cells (99). Each row of the heatmap is a regulated exon with its flanking region. The positions of peaks are shaded dark red; PTBP1 motifs inside or outside the clusters are shown as black and light red, respectively. The metaprofile of significant crosslink clusters is plotted below. The enrichment of peaks around regulated exons compared to control indicates the mechanisms of splicing regulation and the specificity of CLIP data. The code to reproduce this figure is available for download at https://github.com/jernejule/clip-data-science. Abbreviations: CLIP, UV crosslinking and immunoprecipitation; eCLIP, enhanced CLIP; HITS, high-throughput sequencing; iCLIP, individual-nucleotide resolution CLIP; nt, nucleotide.

