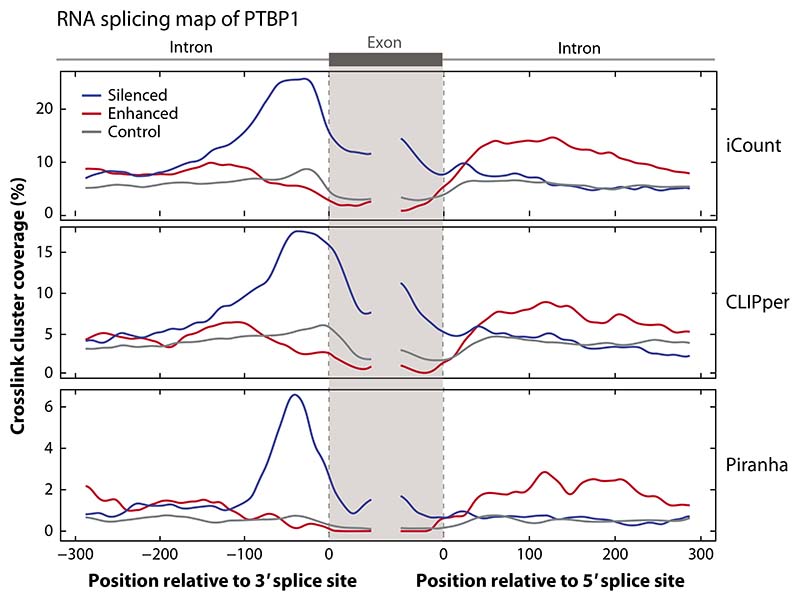
Figure 4.
A comparison of different CLIP peak calling tools. RNA maps are used to demonstrate the differences in peak calling tools for the same iCLIP PTBP1 data set (16). To show that the RNA maps can be reproduced by exons defined using a different data source, we defined the regulated exons using RNA-seq data following PTBP1 CRISPR knockout in K562 cells from the ENCODE website. We identified the skipped exons detected using rMATS (101) using only junction counts and a p-value threshold of 0.05 and FDR threshold of 0.1. Silenced and enhanced exons were defined using an inclusion level difference threshold of 0.05; control exons were selected as those with a p-value greater than 0.1, an FDR value greater than 0.1, an inclusion level of less than 0.9, and an inclusion level difference less than 0.05. We compared the peaks called using iCount (15) (using a 15-nucleotide peak calling half-window and 30-nucleotide clustering window), Piranha (42) (using a 30-nucleotide bin size and 30-nucleotide merging window), and CLIPper (25, 44) (using default settings). For this data set, Piranha and iCount have runtimes of ∼2 minutes and ∼7 hours, respectively, using 1 processor; CLIPper has a runtime of ∼7 days using 20 processors. The code to reproduce this figure is available for download at https://github.com/jernejule/clip-data-science. Abbreviations: CLIP, UV crosslinking and immunoprecipitation; FDR, false discovery rate; iCLIP, individual-nucleotide resolution CLIP.

