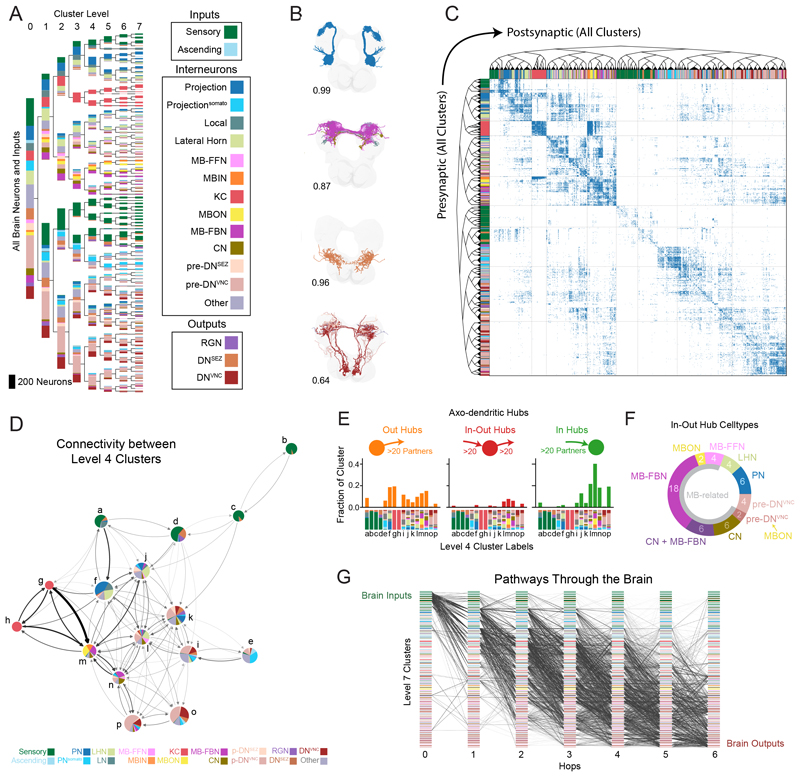
Fig. 3. Hierarchical clustering and analysis of brain structure.
(A) Hierarchical clustering of neurons using a joint left-right hemisphere spectral embedding based on connectivity. Clusters were colored based on cell classes (Fig. 1G and fig. S4), but this information was not used for clustering. Clusters were sorted using signal flow. (B) Example clusters with intracluster morphological similarity score using NBLAST (see Methods). (C) Adjacency matrix of the brain sorted by hierarchical cluster structure. (D) Network diagram of level 4 clusters displays coarse brain structure. Colored pie charts display cell types within clusters. (E) Fraction of a-d hub neurons in level 4 clusters. Cell types of each cluster are depicted on the x-axis and annotated to match clusters in (D). Hubs were defined as having ≥20 in- or out-degree (≥20 presynaptic or postsynaptic partners, respectively; based on the mean degree plus 1.5 standard deviations). (F) Cell classes of in-out hubs (a-d). Most neurons were downstream or upstream of the memory and learning center (gray semicircle, MB-related). Note that CN + MB-FBN indicates neurons that were both CNs and MB-FBNs. One pair of pre-DNVNC neurons received direct MBON input. (G) Pathways from SNs to output neurons with 6 or fewer hops, using a pairwise ≥1% input threshold of the a-d graph. Plot displays a random selection of 100,000 paths from a total set of 3.6 million paths.

