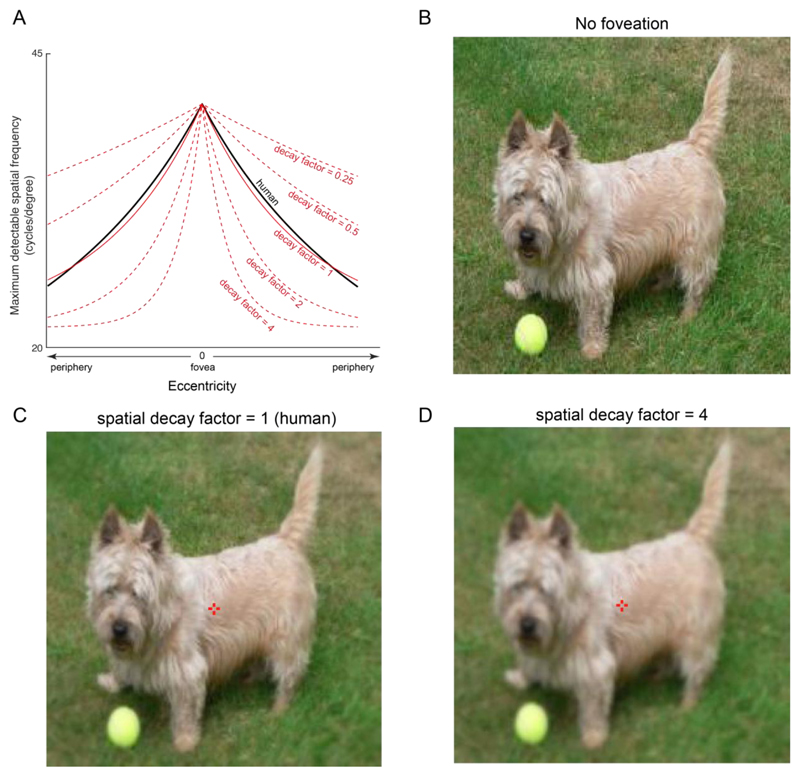
Figure 2. Example foveated images with varying peripheral blur profiles.
(A) Human contrast sensitivity function (solid black line) and the corresponding exponential fit (solid red line). The spatial decay of the exponential was varied by scaling the human exponential fit to obtain shallower or deeper blur profiles (dashed red lines).
(B) Example full resolution image
(C) Same as panel B but foveated on the object center (red cross) with a spatial decay of 1, which corresponds to the human peripheral blur function. At the appropriate viewing distance, fixating on the red cross will make this image look identical to the full resolution image in panel B.
(D) Same as panel B but foveated with a more extreme peripheral blur (spatial decay factor = 4).

