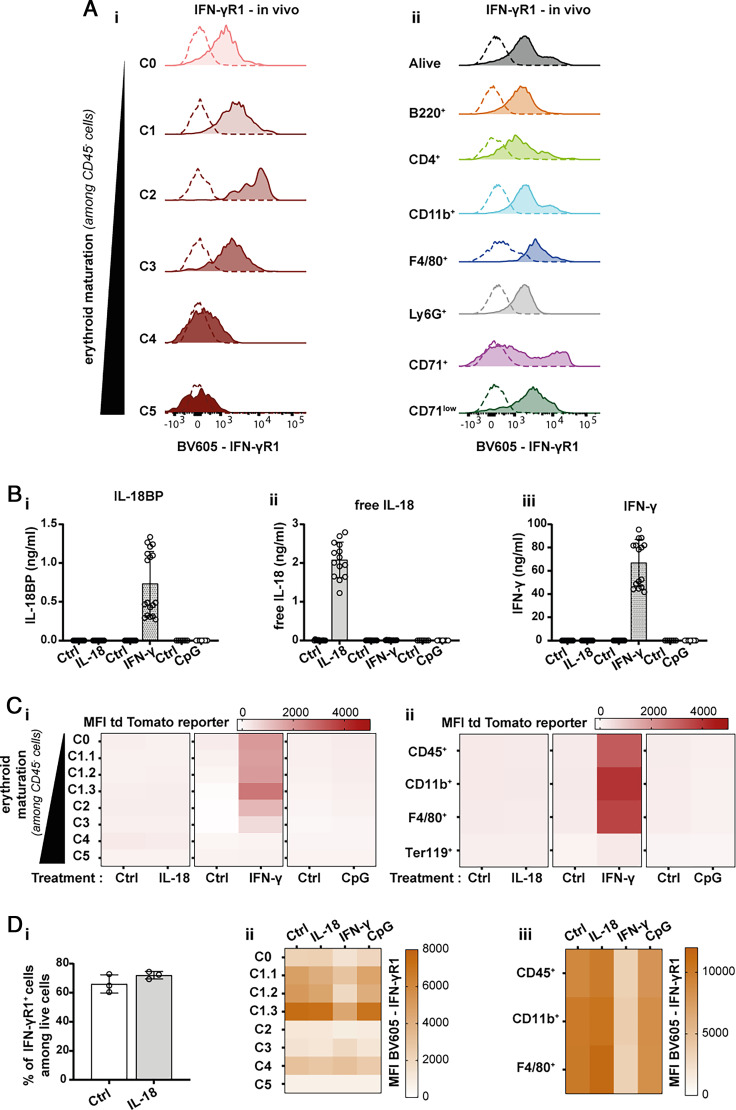
FIGURE 6.
Early erythroid precursors produce IL-18BP in an IFN-γ-dependent manner. (A) Representative histograms for in vivo expression of IFN-γR1 by (Ai) erythroid precursors and (Aii) other cell types present in the BM of naive WT mice (n = 4). (B) Assessment of (Bi) IL-18BP, (Bii) free IL-18, and (Biii) IFN-γ levels in the supernatants of in vitro differentiated WT RBCs stimulated with rmIL-18 (100 ng/ml), rmIFN-γ (100 ng/ml), or CpG (1 µg/ml) (each individual symbol represents one culture well, n ≥ 6 pooled from at least two independent experiments). Results are represented as mean ± SD. The detection limits of the IL-18BP, free IL-18, and IFN-γ measurements correspond, respectively, to 0.031 ng/ml, 12.3 pg/ml, and 15.6 pg/ml. (C) Heat map representation of the mean fluorescence intensity (MFI) of tdTomato reporter expression (Ci) in each erythroid precursor subtype (from C0 to C5 in the order of maturation) or (Cii) in other cell types following stimulation with rmIL-18 (100 ng/ml), rmIFN-γ (100 ng/ml), or CpG (1 µg/ml) of in vitro differentiated RBC cultures isolated from naive KI mice. (D) In vitro differentiated WT RBCs from naive WT mice were stimulated or not with rmIL-18 (100 ng/ml), rmIFN-γ (100 ng/ml), or CpG (1 µg/ml). Expression of IFN-γR1 was analyzed by flow cytometry. (Di) Percentage of IFN-γR1+ cells among live cells following rmIL-18 and rmIFN-γ stimulation. (Dii) Heat map representation of the MFI of IFN-γR1 expression in each erythroid precursor subtypes (from C0 to C5 in the order of maturation) or (Diii) in other cell types following each stimulation. The means were calculated from n ≥ 3 wells, and data were generated from at least two independent experiments (with the exception of the reporter MFI measurement following CpG stimulation and the in vitro expression of IFN-γR1 from one experiment).

