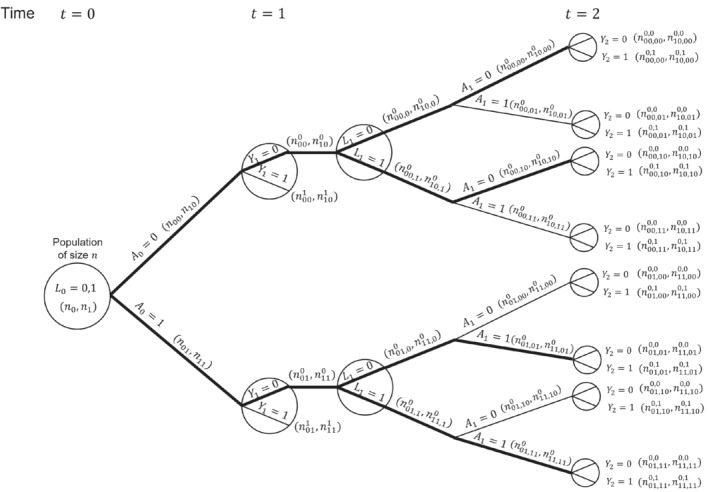
FIGURE 2.

Causal tree diagram illustrating a study with a binary treatment and binary covariate , both measured at two time points (). is a discrete time survival outcome. Thick lines indicate branches for groups of individuals who were untreated or treated at both time points.
