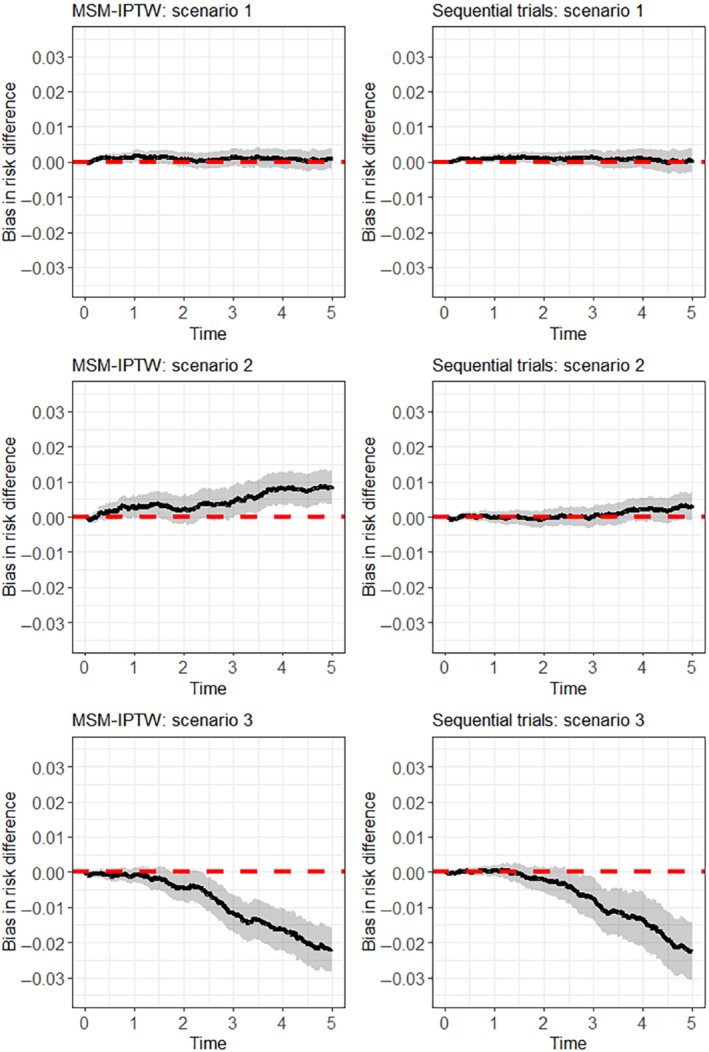
FIGURE 5.

Simulation results: bias in estimation of the risk difference using the sequential trials analysis and the MSM‐IPTW analysis. The black line shows the bias at each time point and the grey area shows the Monte Carlo 95% CI at each time point.
