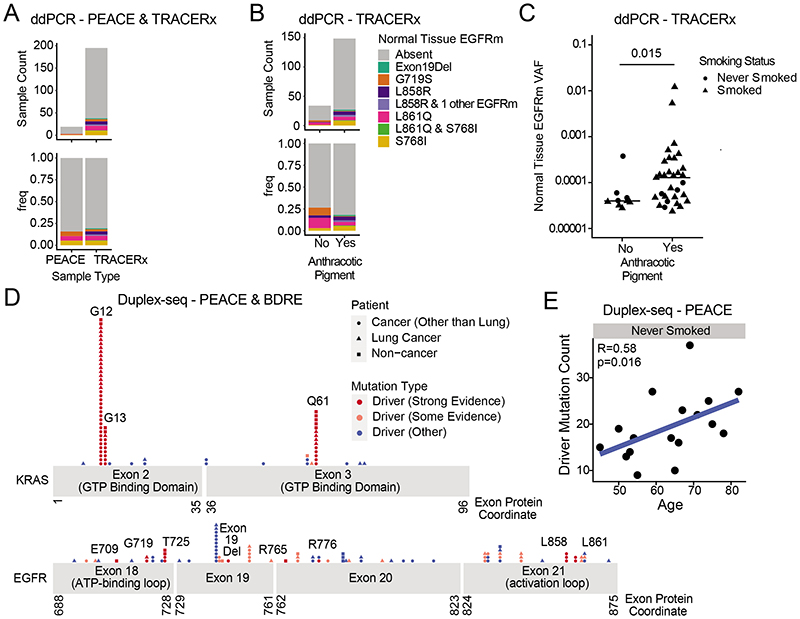
Fig. 4. Mutational landscapes of healthy lung tissue.
a, Counts and proportions of non-cancerous lung samples from PEACE (n = 19) and TRACERx (n = 195) patients that harbour EGFR mutations (EGFRm) identified using ddPCR. The EGFR mutation type is indicated by the colour of the bars (key in b). b, Count and proportion of healthy lung samples from the TRACERx dataset (organized according to anthracotic pigment content: yes (n = 149); no (n = 34)) that harbour EGFR mutations identified by ddPCR. The EGFR mutation type is indicated by the colour of the bars. c, Proportion test Beeswarm plot of ddPCR TRACERx data indicating the VAFs of EGFR mutations. Samples organized according to presence (yes; n = 31) or absence (no; n = 9) of anthracotic pigment. Shapes of dots indicate smoking status. Two-sided t-test. d, Gene models of KRAS (top) and EGFR (bottom), where dots represent mutations identified in the Duplex-seq PEACE and Duplex-seq BDRE cohorts. The position of the dots correspond to the loci of the mutations, whereas the height of the stack indicates the count of the number of mutations at a particular protein coordinate. The shape of the dot indicates the disease diagnosis of the patient, whereas the colour of the dot indicates the mutation type. e, Scatter plot displaying the correlation between age and the number of driver mutations identified in samples from never-smoker individuals (n = 17) in the Duplex-seq PEACE cohort, for which the panel comprised genomic loci in 31 genes, including EGFR and KRAS. Spearman correlation coefficient and P value are indicated in the plot

