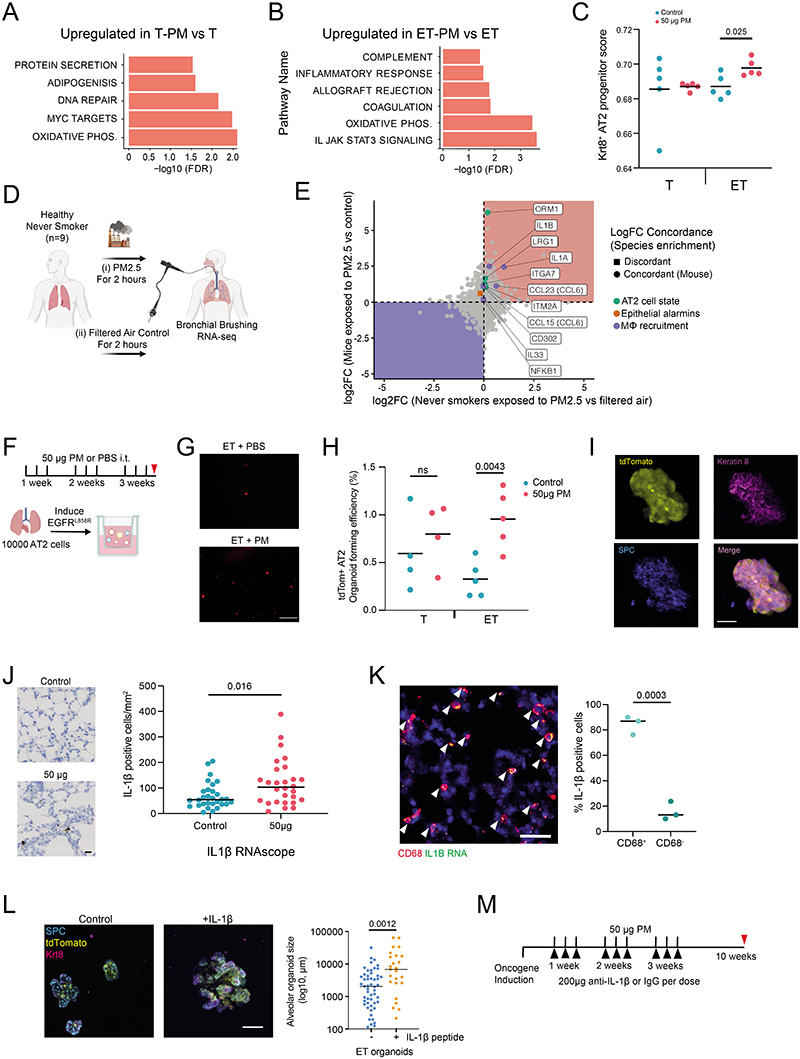
Extended Data Figure 5.
A-B) Significantly enriched GSEA pathways upregulated in T-PM lung epithelial cells compared to T control mice (A), in ET-PM lung epithelial cells compared to ET control mice (B). For each comparison, barplots indicate the -log10(FDR) of the Komogolomov-Smirnoff test p-value for each pathway. C) Krt8+ AT2 progenitor score derived from scRNAseq of bleomycin treated mouse lung used to deconvolute bulk RNA-seq of T and ET mice exposed to 50 μg PM or PBS, (n= 5 mice per group). Welch's t-test between control and PM. D) Schematic displaying experimental set-up of clinical exposure study in never-smoker volunteers, crossover design with (i) and (ii) in random order separated by 4-week washout. E) Fold change (FC) of significantly upregulated genes (identified in mouse) compared to the fold change of genes changed in the clinical exposure study. Common directionality across species indicated by colour (negative: blue background; positive: red background). F) Schematic of AT2 culture from T or ET mice exposed to 50 μg PM or PBS, with induction of tdTomato or oncogene ex vivo. G) Representative fluorescent images of tdTomato+ AT2 organoids at day 14 from ET mice exposed to PBS or 50 μg PM in vivo. Scale bar 100 μm. H) Quantification of tdTom+ AT2 organoid forming efficiency, data represents averages from 2 technical replicates/mouse; n=4 mice from T control and PM; n=5 mice for ET control and PM. One-way ANOVA. I) Representative fluorescent imaging of tdTomato (yellow), Keratin 8 (magenta), SPC (blue) on a wholemount AT2 organoid from an ET mouse treated with 50 μg PM. Scale bar is 20 μm. J) LEFT: Representative IL-1β RNAscope performed on lungs from ET mice treated with PBS or 50 μg PM after 3 weeks of exposure. Scale bar 20 μm. RIGHT: Quantification of IL-1β+ cells per mm2 of lung tissue from 30 random fields of view (control, n = 3 mice) and 28 fields of view (50 μg PM, n = 3 mice). Mann-Whitney test p-value is displayed. K) LEFT: Representative image of IL-1β RNAscope (green) in CD68 positive (red) macrophages, arrows indicate positive macrophages. n=3 mice per group. Scale bar 50 μm. RIGHT: Quantification of IL-1β positive CD68+ cells at 3 weeks post induction in ET mice following exposure to PM. Mann-Whitney test. L) LEFT: Representative fluorescent images of EGFRL858R naive (non-PM exposed) AT2 organoids from ET mice treated with control or IL-1β in vitro. tdTomato (yellow) organoids stained with SPC (blue) and Keratin 8 (magenta). Scale bar 50 μm. RIGHT: Quantification of organoid size with each dot representing an organoid at day 14 of control (blue) or IL-1β treated (orange). Organoids derived from n=2 mice per group. Mann-Whitney test. M) Schematic of anti-IL-1β treatment treatment (black triangles) during PM exposure (black lines) and harvest (red triangle)

