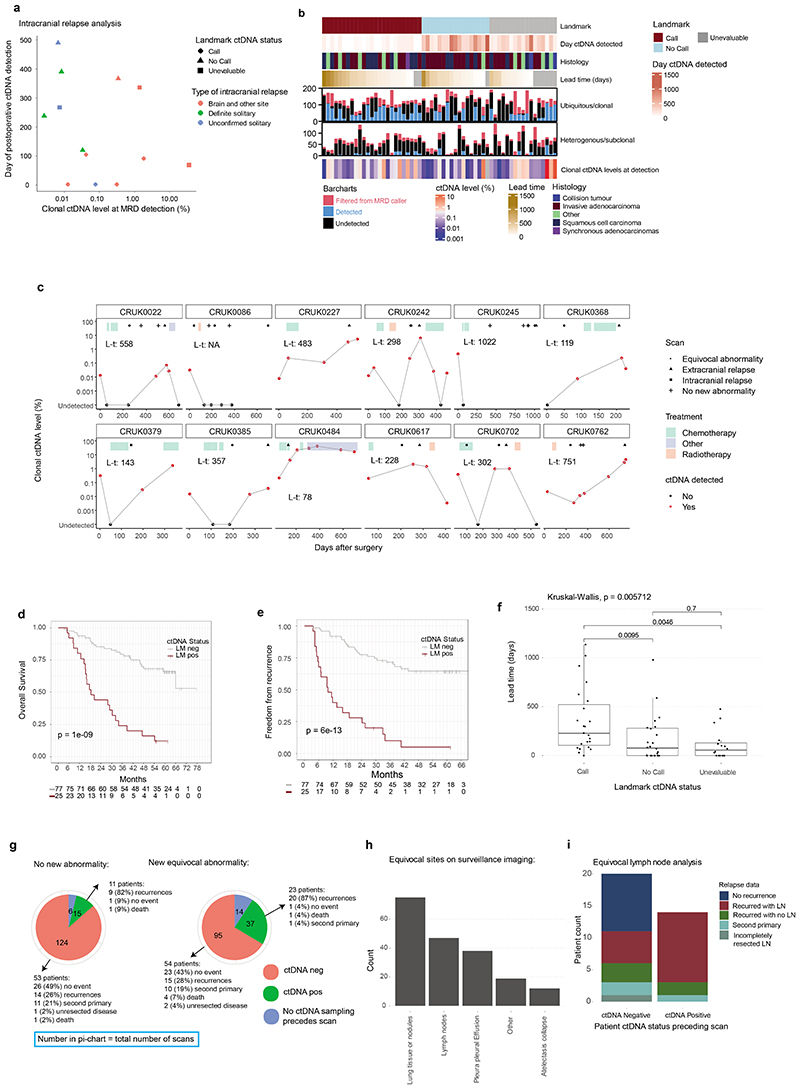
Extended Figure 6. Expanded postoperative ctDNA and imaging surveillance analysis.
A. Analysis of 13 patients who experienced intracranial relapse who were positive for ctDNA in a postoperative blood sample. The X axis shows the clonal ctDNA level at the point of postoperative ctDNA detection and the Y axis shows the day of postoperative ctDNA detection. Points are coloured based on whether the intracranial relapse was solitary (green), accompanied by another extracranial site (red), or unconfirmed solitary (blue, no extracranial imaging performed) and are shaped by landmark ctDNA status. B. Heatmap of clonal mutation ctDNA level data at first postoperative ctDNA detection. The annotation rows show the landmark ctDNA status of the patient (landmark positive, ctDNA detected within 120 days postoperatively; landmark negative, ctDNA negative within 120 days postoperatively; unevaluable, landmark status cannot be established), the day ctDNA was detected postoperatively, the histology of the primary tumour, and lead time (days from ctDNA detection to clinical relapse). Where lead time was not applicable (for example incompletely resected disease, ctDNA detected post-relapse, see methods) lead time is coloured grey. The next two rows (bar charts) demonstrate the number of clonal or subclonal mutations tracked by an AMP patient-specific panel (PSP); if the bar is blue, it represents confident detection of an individual variant (based on an individual variant P value of <0.01 [one sided Poisson test based on MRD caller output, see methods]), if the bar is black, it represents absence of confident calling of a variant, if the bar is red, it represents that a variant was filtered by the MRD calling algorithm. The final row represents the mean clonal ctDNA level at the first ctDNA detection time point for a patient. This is on a log-10 scale as displayed in the heatmap legend. For patient CRUK0296, ctDNA detection occurred but clonal ctDNA levels were 0% (grey bar) as the mutation driving ctDNA detection postoperatively did not have a clonal status. C Longitudinal per-patient plots in 12 patients who were ctDNA positive prior to adjuvant therapy. Plots are annotated with lead time (L-t), scans performed, and treatment administered (see legend). The Y axis represents clonal ctDNA levels and each circle on the plot represents a blood sampling time point. If the circle is red, it indicates that the blood sample was positive for ctDNA using the MRD caller. The X axis displays days post-surgery. D-E. Kaplan-Meier curves in the landmark evaluable population (patients who donated blood within 120 days post-surgery before treatment or clinical recurrence, n=102/108 landmark evaluable patients were evaluable for survival analysis, see methods for exclusions) showing overall survival (OS,D) or freedom from recurrence (FFR,E) outcomes for landmark positive (dark red) versus landmark negative (grey) patients. Log-rank P values displayed on curves. F. Boxplots showing the distribution of lead times (times from ctDNA detection to clinical recurrence) categorised by patient landmark ctDNA status. Hinges correspond to first and third quartiles, whiskers extend to the largest/smallest value no further than 1.5x the interquartile range. Centre lines represent medians. Kruskal-Wallis test P=0.0057, unadjusted pairwise Wilcoxon-tests compare individual categories, n=63 patients analysed. G. Pie charts demonstrate the number of occurrences of specified ctDNA detection statuses (red – ctDNA negative, green – ctDNA positive, blue – no ctDNA status established), preceding a scan showing no new changes (left) or new equivocal extracranial changes (middle). The ctDNA positive and negative categories are then broken down further into a patient-level analysis showing the outcomes of patients who experienced the occurrence of the specified imaging and ctDNA status event(s). H. Barchart showing the count of specific equivocal anatomical sites noted on scans showing new equivocal changes; equivocal lung lesions and lymph nodes were the most common abnormal equivocal findings on NSCLC surveillance imaging. Multiple equivocal sites can be observed on one scan. I. Barplot of eventual site of relapse and ctDNA status in 33 patients with ctDNA status established prior to surveillance imaging, showing new equivocal lymph node enlargement. The X axis shows the patient ctDNA detection status preceding surveillance scans. The Y axis shows the patient count. Patient CRUK0090 exhibited occurrences of both negative and positive ctDNA statuses prior to separate equivocal lymphadenopathy scans, so is present in both ctDNA positive and negative categories. Other patients are only included once. Patient CRUK0234 was diagnosed with an unresected lymph node, was ctDNA negative postoperatively and included in the analysis. The barcharts are filled with recurrence status of patients in these categories. Recurred with LN refers to lymph node involvement at relapse (dark red colour). Recurred with no LN refers to recurrence with no lymph node involvement (green colour).

