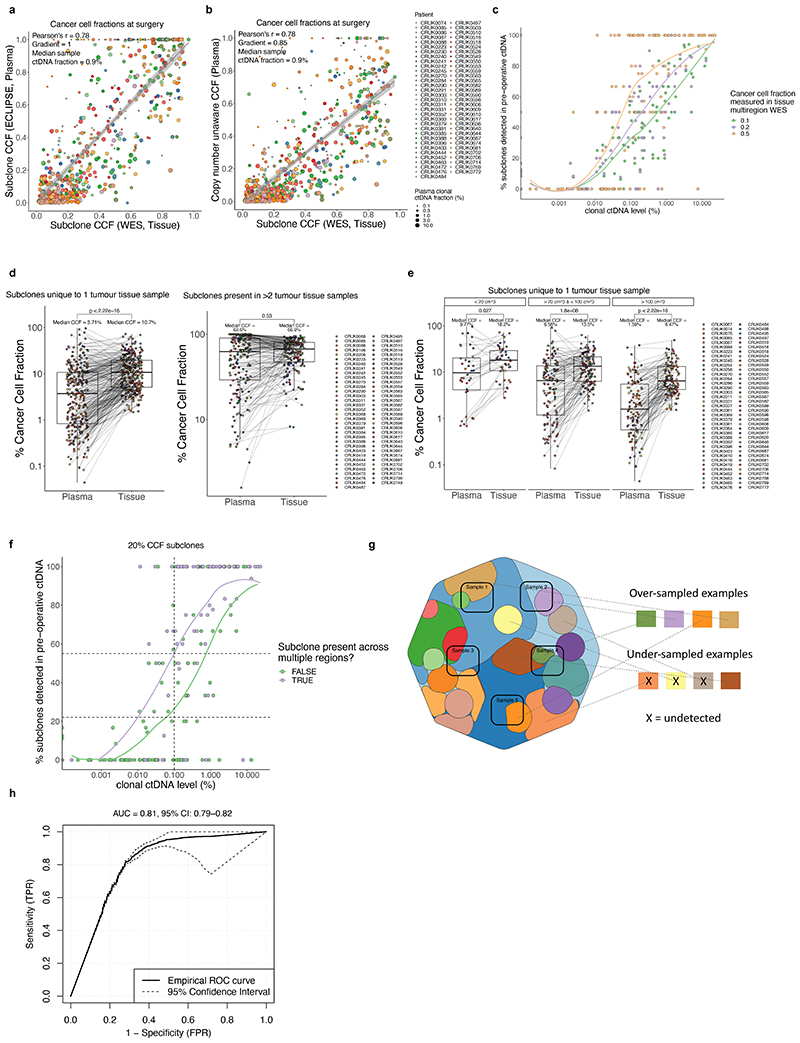
Extended Figure 9. Time-matched comparisons between subclonal structure measured in plasma and in tissue at surgery.
A. Correlation between cancer cell fractions (CCFs) as measured in preoperative plasma samples with phylogenetic data, >0.1% clonal ctDNA level & >=10ng DNA input (high subclone sensitivity samples) with ECLIPSE and those measured with multi-region tissue sequencing (M-seq) at surgery (N=71 patients and 684 subclones included). B. Copy number unaware CCFs calculated only using VAFs (methods) compared to tissue CCF from M-seq. All preoperative samples with phylogenetic data, >0.1% clonal ctDNA level & >=10ng DNA input (high subclone sensitivity samples) were included (N=71 patients and 684 subclones included). C. A scatter plot demonstrating the relationship between clonal ctDNA level and the proportion of multi-region tumour exome (M-seq) defined subclones detected by ECLIPSE based on varying subclonal cancer cell fractions as indicated, loess lines are fitted to the plots, n= 117 ctDNA positive preoperative samples. D. A comparison of pre-operative plasma CCFs and the average CCFs across all tissue regions sampled at surgery for clones that were unique to one tumour tissue region and for clones that were distributed across more than two tumour tissue regions. N=71 patients and 684 subclones included. A Wilcoxon-test was used to compare groups. E. A comparison of pre-operative plasma CCFs and the average CCFs across all tissue regions sampled at surgery for clones that were unique to one tumour tissue region separated between small (<20cm3), medium (>20cm3 & <100cm3), and large (>100cm3) tumours as measured on pre-operative PET/CT scans. N=71 patients and 684 subclones included. A Wilcoxon-test was used to compare groups. F. A comparison of detection rates in pre-operative plasma for 20% CCF subclones across a range of clonal ctDNA levels split by whether the subclones were spread across multiple primary tumour tissue regions or were limited to only a single primary tumour tissue region. 1924 subclones were assessed in 197 preoperative plasma samples. G. A map of tumour clones with areas of multi-regional tissue sampling indicated and clones which are over- and undersampled highlighted. Most of the undersampled clones are in fact not in the sampled areas creating a bias towards oversampling in clones which we are able to detect, an effect also called the 'winner's curse'. H. A ROC curve describing the sensitivity and specificity of detecting clonal illusion mutations using plasma-based CCFs with 95% confidence intervals generated using bootstrapping across 500-fold cross-validation (N= 71 tumours).

