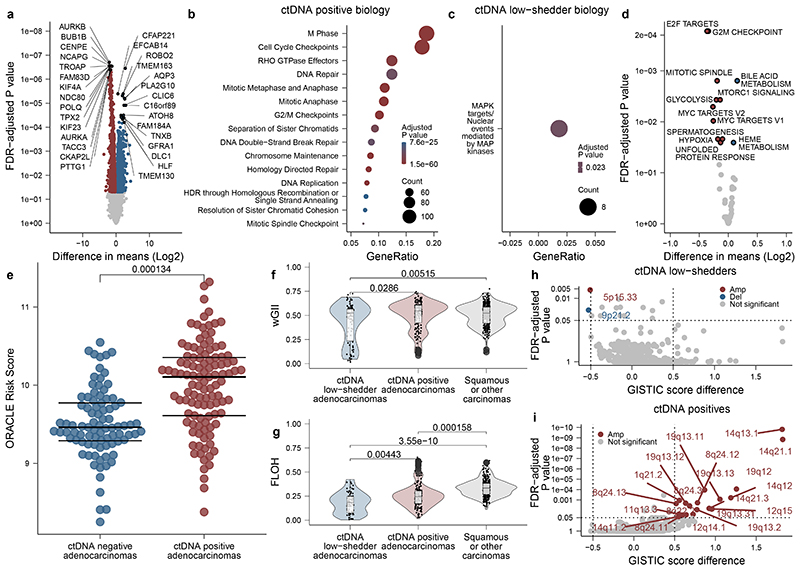
Figure 2. Genomic and transcriptomic predictors of ctDNA detection in early-stage NSCLC.
A. Differential gene expression analysis comparing 34 ctDNA positive adenocarcinomas (101 regions) to 28 ctDNA low-shedder adenocarcinomas (62 regions). X axis shows log2 difference in means, Y axis shows two-sided FDR adjusted P values. Statistical testing is carried out by computing moderated t-statistics from a linear model fit to the transformed expression data (methods). Red and blue: genes significantly over-expressed in ctDNA positives and ctDNA low-shedders (technical non-shedders excluded), respectively. Top 15 genes are labelled per detection category. B, C. Reactome pathway enrichment analysis based on the 1,759 significant genes found in A. Y axis lists pathways, X axes shows proportion of genes involved. B. Top 15 pathways in ctDNA positives. C. The only significantly enriched pathway in ctDNA low-shedders. Size: gene count, colour: one-sided hypergeometric P value. D. Differential enrichment analysis based on the Hallmark gene-sets. Samples, axes and colours follow A. E. ORACLE gene expression scores in ctDNA positive (35 patients, 109 regions) versus ctDNA negative (42 patients, 87 regions) adenocarcinomas. Centre lines show medians. Colours follow A. F, G. Violin-boxplots showing wGII and FLOH levels of ctDNA positive adenocarcinomas (35 patients, 166 regions), ctDNA low-shedder adenocarcinomas (28 patients, 79 regions) and squamous or other carcinomas (74 patients, 303 regions). Hinges correspond to first and third quartiles, whiskers extend to the largest/smallest value no further than 1.5x the interquartile range. Center lines represent medians. H, I. GISTIC score analysis comparing 35 ctDNA positives (166 regions) and 28 ctDNA low-shedders (79 regions). Red: amplifications, blue: deletions, grey: non-significant values. Y axis: one-sided P values computed by GISTIC 2.0's permutation-based statistical methods, X axis: GISTIC score difference. Dotted lines: G-score and significance cutoffs. Pairwise comparisons are performed using linear mixed-effects models, P values are two-sided.

