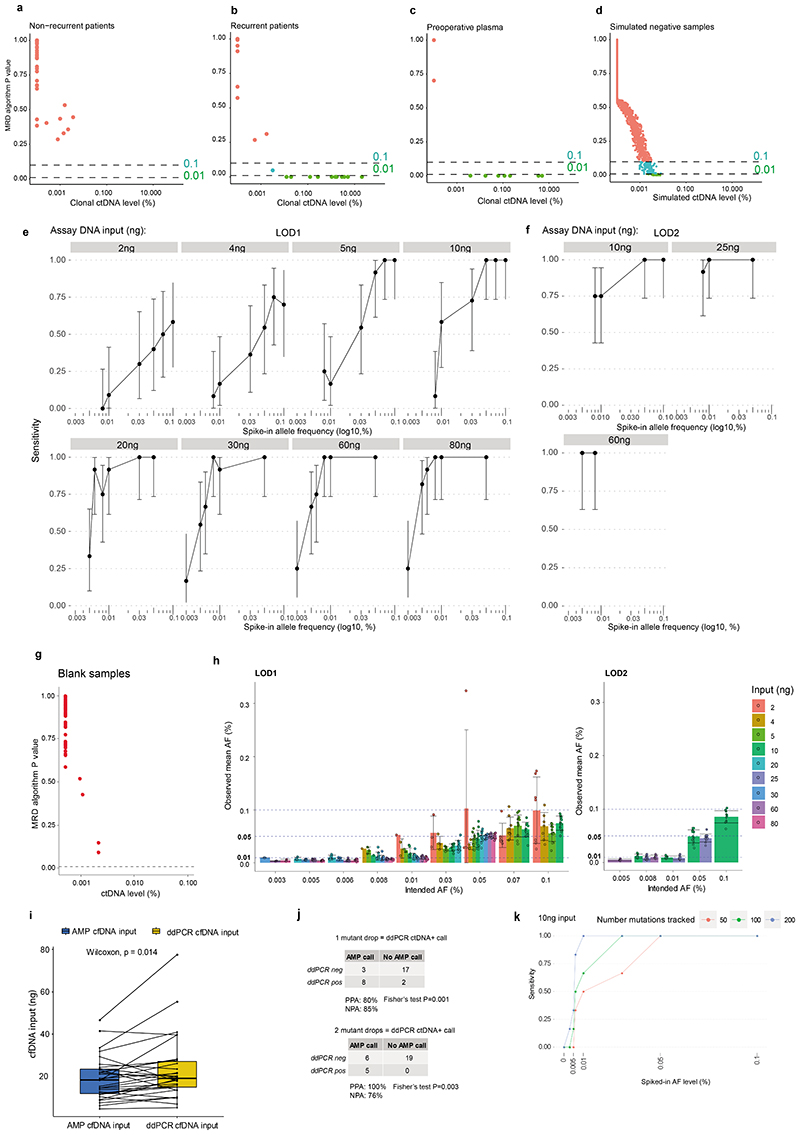
Extended Figure 2. MRD calling thresholds and analytical validation.
A-D. Postoperative MRD caller P values (one-sided Poisson test, see methods) observed in pilot-phase of the project. A. n=5 patients who did not have recurrence of their NSCLC; all n=55 patient samples had caller P values in excess of P > 0.1 threshold meaning that they were deemed negative for ctDNA. B. Postoperative caller P values observed in n=5 patients who had relapse of their NSCLC. 1 of 13 calls was made between caller P values of 0.1 and 0.01, the remaining 12 calls were made at a caller P value less than 0.01. C. Preoperative ctDNA calls from pilot cohort; 7 patients had positive ctDNA in plasma prior to surgery, all calls were made at caller P values <0.01. D. In-silico simulation analysis to assess MRD caller specificity. 3157 mock MRD panels were generated within the evaluable pilot patient libraries and MRD caller P values were assessed. At a caller P value <0.1 threshold, 121/3157 simulated mock panels were ctDNA positive (in-silico specificity of 96.2%); at a caller P value threshold <0.01, 22/3157 simulated mock panels were ctDNA positive (in-silico specificity of 99.3%). E-F. Analytical validation of 50 variant MRD detection panels. E. Fragmented DNA with a known single nucleotide polymorphism (SNP) profile was spiked into a second background of fragmented DNA with a different SNP profile and a patient-specific panel targeted 50 alternate positions present in spiked-in DNA. 559 data points were generated across different DNA input quantities indicated, to establish the limit of detection plots. The Y axis and centre of the error bars demonstrate sensitivity (defined as the proportion of all repeats that resulted in MRD detection using a caller P value of 0.01). The confidence intervals on the plot are Clopper-Pearson confidence intervals (95% CIs). The X axis shows the quantity of variant germline DNA that was spiked into each repeat expressed as a percentage of total DNA in that sample. F. Circulating tumour DNA samples with high variant allele fractions were spiked into a different cell-free DNA background. Variant positions in ctDNA were targeted with a 50 variant panel; 100 data points were generated across the DNA input quantities indicated. Axes and error bars are the same as (E). G. Data from analyses of 48 blank samples donated by 24 healthy participants, caller P values are displayed. H. Barplots demonstrating the intended allele frequencies and the measured allele frequencies in the different spike-ins presented in part (E) and part (F) only data from variant DNA positive samples are presented. The colours of the barplot represent different DNA input masses as shown by the legend. The error bars on the plot represent the mean value of all positive spike-in samples +/- standard deviation of the values. Where the error bar is absent, this is because at this spike-in level and DNA input mass, only one positive sample was observed. Where the error bar led to an observed mean AF less than 0, the error bar was stopped at 0 for visualisation purposes (the 0.05% spike-in, 2ng input mass case). The horizontal dashed lines correspond to 0.1%, 0.05%, and 0.01% spike-in categories. Each data point is represented on the plots by a circle. n=369 variant DNA positive samples displayed in LOD1 barchart, n=93 variant DNA positive samples displayed in LOD2 barchart. I. Comparison between the content of cell-free DNA input into ddPCR reactions (yellow) and AMP PCR reactions (blue). Hinges correspond to first and third quartiles, whiskers extend to the largest/smallest value no further than 1.5x the interquartile range. Centre lines represent medians. Each dot on the plot represents a data point, lines connect paired samples from the same patient. Significantly more cell-free DNA was input into ddPCR reactions (paired two-sided Wilcoxon-test P=0.01366). J. Orthogonal comparison between ctDNA detection based on AMP panels used in TRACERx and ddPCR against a single clonal variant. ddPCR ctDNA positive call threshold was two mutant droplets (bottom table) and one mutant droplet (top table). Percentage positive agreement (PPA) and percentage negative agreement (NPA) using ddPCR as the comparator is displayed in the table. Two-sided Fisher's test P values are demonstrated under the cross tables. K. A 300 mutation patient-specific panel was designed and applied to 10ng DNA samples containing spike-in variant levels from 0% to 0.1%. In silico sub-sampling of the 300 mutations was performed (3 x 200 mutation in silico panels, 3x 100 mutation in silico panels and 3x 50 mutation in silico panels, see methods) and sensitivities are categorised by the number of mutations targeted by the panel.

