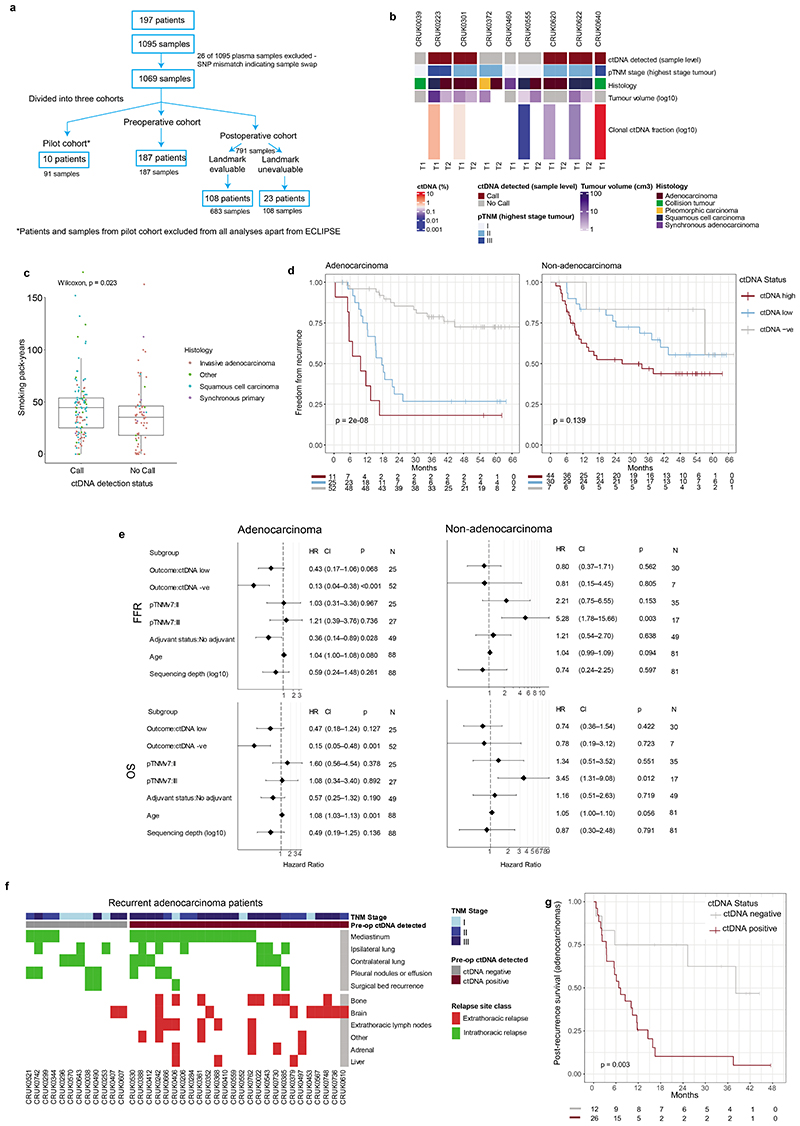
Extended Figure 3. Preoperative ctDNA detection.
A. Flow diagram demonstrating different cohorts analysed in this manuscript; the top part of the flow diagram shows the total number of plasma samples that were intended to be analysed (n=1095 from 197 patients) which reduced to 1069 samples due to single nucleotide polymorphism mismatches between cfDNA and tissue exome data in 26 cases, suggesting sample swap. These samples were analysed in 3 main cohorts, the pilot cohort (left), the preoperative cohort (middle), and the postoperative cohort (right). The postoperative cohort was divided into different categories based on landmark evaluability (relating to samples donated within 120 days of surgery to enable a landmark ctDNA analysis). B. Heatmap demonstrating individual tumour-specific clonal ctDNA fractions in patients with synchronous primaries diagnosed at baseline. The annotation rows of the heatmap show the ctDNA call present in that sample across all variants interrogated by the MRD caller, the highest pathological TNM stage, the individual histology, and individual tumour volumes of the two synchronous tumours present at baseline (for this category, grey represents absent data or volume unevaluable). C. Boxplot demonstrating the difference in pack-year history across 187 preoperative ctDNA positive NSCLC patients and preoperative ctDNA negative NSCLC patients. Hinges correspond to first and third quartiles, whiskers extend to the largest/smallest value no further than 1.5x the interquartile range. Centre lines represent medians. P value represents a Wilcoxon-test. D. Kaplan-Meier curves demonstrating freedom from recurrence outcomes in ctDNA high (dark red), ctDNA low (blue), and ctDNA negative (grey) single primary adenocarcinoma patients (left) and single primary non-adenocarcinoma patients (right). ctDNA high and low were categorised based on median clonal ctDNA levels across ctDNA positive cases and relate to above and below 0.16%. Log-rank P values are displayed on each plot. E. Multivariable Cox regression analyses of Overall Survival (OS) and Freedom From Recurrence (FFR, defined as recurrence only) in patients with single (non-synchronous) NSCLC; evaluating ctDNA detection status, pTNM stage (Tumour Node Metastasis pathological stage version 7, categories I, II or III), whether adjuvant therapy was administered, age, and log10-transformed unique sequencing depth as predictors in adenocarcinomas and non-adenocarcinomas separately. Unique sequencing depth was included to adjust for under sequenced samples, representing potential false negatives. n=88 adenocarcinoma patients and n=81 non-adenocarcinoma patients were analysed for FFR and OS. On the forest plots, the diamond represents the multivariable Hazard Ratio (HR) with error-bars corresponding to 95% confidence intervals (CI). Multivariable P values (p) are displayed on the plot alongside the number of patients in each category (N). Reference categories were ctDNA positive patients, pTNM stage I patients and patients given adjuvant therapy. The exact Cox regression P value for the Outcome: ctDNA -ve category in the FFR adenocarcinoma plot = 0.00022. F. Heatmap showing the site of relapse in recurrent adenocarcinoma cases divided by whether preoperative ctDNA was detected (dark red, right) or undetected (grey, left). Intrathoracic (mediastinum, locoregional, ipsilateral lung, distant lung – green colours) or extrathoracic (bone, brain, liver, adrenal, extrathoracic lymph nodes or other extrathoracic site – red colours) sites of relapse are shown (sites shown are metastatic sites diagnosed within 180 days of clinical relapse). Heatmap is annotated by Tumour Node Metastasis pathological version 7 stage. G. Kaplan-Meier curve demonstrating post-relapse survival in recurrent adenocarcinoma patients stratified by preoperative ctDNA positive (red) or preoperative ctDNA negative (grey). Log-rank P value is displayed on the plot.

