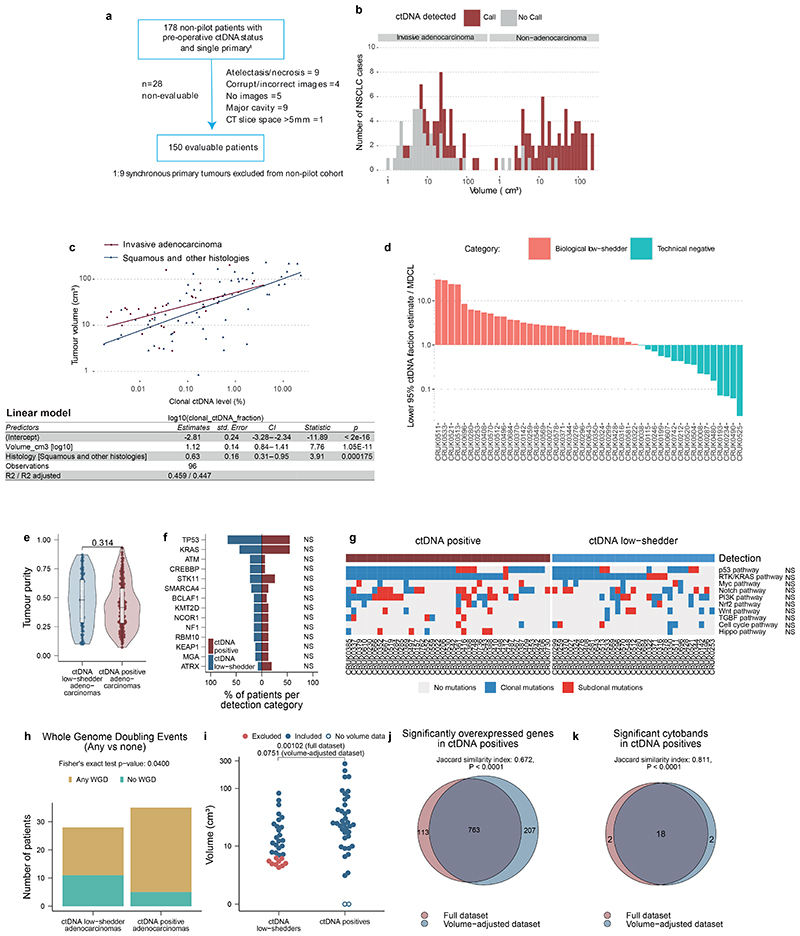
Extended Figure 4. Volume and phenotypic analysis of ctDNA positive and ctDNA negative adenocarcinomas.
A. Flow chart demonstrating patients available for volumetric analyses and reasons for exclusion. B. Histogram showing the number of NSCLC cases by volume, with ctDNA positive samples shown as red bars, and ctDNA negative samples shown as grey bars. n=150 volume evaluable cases. C. Volume versus log10-transformed clonal ctDNA level correlation plot with each individual TRACERx case that was ctDNA positive as a point and coloured by adenocarcinoma status (dark red) and squamous or other histology (dark blue). Fitted line represents a linear model line categorised by tumour histology. Below the correlation plot is a table describing a linear multivariable model based on these data to predict log10-transformed clonal ctDNA levels based on tumour volume and histology (adenocarcinoma and squamous and other categories). P values represent linear model adjusted P values, n=96 ctDNA positive, volume evaluable NSCLCs analysed. D. Based on a multivariable linear regression model fitted to the data in (C), we categorised ctDNA negative adenocarcinomas as biological low-shedders or technical non-shedders (see methods). If a particular tumour volume resulted in an estimated clonal mutation ctDNA level above the clonal ctDNA level a library could detect (95% lower confidence interval for estimated clonal ctDNA level based on tumour volume is above detectable clonal ctDNA level in the preoperative cfDNA library from that patient), then the case was classed as a probable biological low-shedder (red on histogram); otherwise, the case was classed as a probable technical non-shedder (turquoise on histogram). Y axis represents the lower 95% confidence estimate for clonal mutation ctDNA level divided by the minimally detectable clonal mutation ctDNA level (MDCL) for that patient's panel. The X axis is each individual patient analysed. Data from n=47 ctDNA negative adenocarcinomas presented. E. Violin box-plots comparing tumour purity in ctDNA low-shedder adenocarcinomas (blue, n = 79 tumour regions from 28 patients) and ctDNA positive adenocarcinomas (red, n = 166 tumour and lymph node regions from 35 patients). Pairwise comparisons are performed using linear mixed-effects models, P values are two-sided. Boxplot hinges correspond to first and third quartiles, whiskers extend to the largest/smallest value no further than 1.5x the interquartile range and centre lines represent medians. Violins represent the distribution of the underlying data. F. Barplots showing gene-level driver alterations between ctDNA positive adenocarcinomas (n = 39 patients) and ctDNA negative low-shedder adenocarcinomas (n = 31 patients). Colours denote ctDNA detection status. Y axis shows the top 14 most frequently altered genes, X axis shows the percentage of patients carrying an alteration in the gene per detection category. NS: Not significant (two-sided Fisher's exact test with FDR P value adjustment). G. Pathway-level driver mutations between ctDNA positive adenocarcinomas (n = 39 patients) and ctDNA negative low-shedder adenocarcinomas (n = 31 patients). X axis shows patient IDs, Y axis shows pathways following the Sanchez-Vega definition. Top bar denotes ctDNA detection status (dark red represents ctDNA positives, blue represents biological low-shedders). Heatmap colours display mutations; blue denote clonal mutations and red denote subclonal mutations. No pathway showed significant enrichment in either ctDNA shedder or non-shedder adenocarcinomas (NS: Not significant, using two-sided Fisher’s exact test with FDR P value adjustment). H. Whole genome doubling status per tumour comparing ctDNA positive adenocarcinomas to ctDNA negative low-shedder adenocarcinomas, using two-tailed Fisher's exact test. Yellow represents the number of tumours subjected to whole genome doubling in at least one region, turquoise represents tumours without any whole genome doublings. I. Volume by ctDNA shedding status. Biological non-shedders in red represent the smallest quartile samples. After removal of these from the analysis, no significant difference in tumour volume was found between ctDNA positives and ctDNA low-shedders. Pairwise comparisons are made with two-sided Wilcoxon-tests. J. Venn diagram showing the overlap between significantly differentially expressed genes between ctDNA positive and ctDNA low shedder adenocarcinomas obtained from the full dataset, relative to the volume-adjusted dataset. Comparisons are made by computing the Jaccard similarity index and the corresponding two-sided P value using the exact method. K. Venn diagram showing the overlap between significantly altered cytobands as called by GISTIC, comparing ctDNA positive to ctDNA low shedder adenocarcinomas obtained from the full dataset, relative to the volume-adjusted dataset. Statistical testing follows (J).

