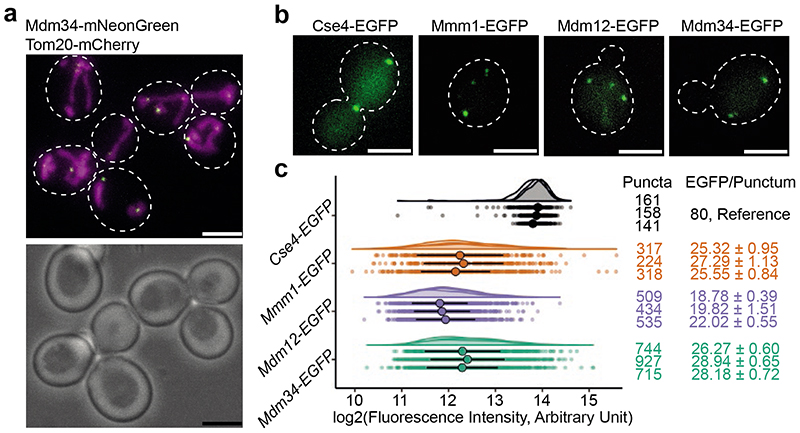
Figure 1. The number of molecules of ERMES components per MCS.
a: Live cell imaging of budding yeast cells expressing Tom20-mCherry (magenta), marking mitochondria, and Mdm34-mNeonGreen (green), marking ERMES-mediated MCS. White dashed outlines mark cell boundaries in the fluorescence image (top) according to bright field image (bottom). b: Live cell FM of yeast cells expressing either Cse4-EGFP, Mmm1-EGFP, Mdm12-EGFP or Mdm34-EGFP, forming diffraction limited puncta. White dashed outlines mark cell boundaries. Cells expressing the kinetochore protein Cse4-EGFP, of which the number of molecules per diffraction limited spot is known36 were used as a reference to determine the number of molecules of ERMES components. c: Fluorescence intensity quantifications of puncta of EGFP-tagged Cse4 (grey), Mmm1 (orange), Mdm12 (purple) and Mdm34 (green), represented as dot plots as well as half-violin plots. Three experimental repeats are shown. Each data point is one punctum. Large points represent median and vertical lines MAD, for each experimental repeat. Using Cse4-EGFP as reference, median +/-MAD fluorescence intensities were transformed into median +/-MAD numbers of EGFP molecules/punctum (right column). Left column indicates number of analysed puncta (N). Scale bars are 3 μm.

