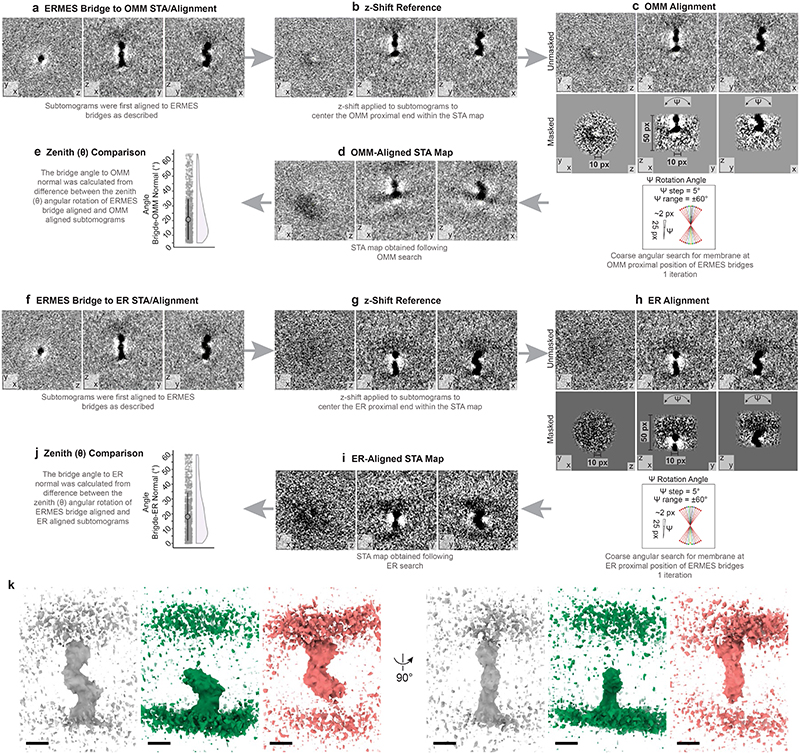
Extended Data Figure 6. Orientation of the bridges relative to the membranes.
a-d: STA alignment strategy to determine the angle between the bridges and the OMM. e: This graph is the same as shown in Figure 3d. Large point indicates median, vertical lines MAD. N=1098 bridges from 51 tomograms. f-i: STA alignment strategy to determine the angle between the bridges and the ER. j: This graph is the same as shown in Figure 3e. Large point indicates median, vertical lines MAD. N=1098 bridges from 51 tomograms. k: Comparison of the STA maps obtained from different alignments. Grey: Full STA map obtained from the alignment strategy depicted in Extended Data Fig. 4. The STA map is the same as shown in Fig 2f and g, displayed at different contour level. Green: STA map obtained from the alignment strategy used to determine the angle between bridges and OMM, as depicted in panels a-d. Red: STA map obtained from the alignment strategy used to determine the angle between bridges and ER, as depicted in panels f-i. Scale bars are 5 nm. Note that due to the perspective view, scale bars apply only to the front plane of the scenes.

