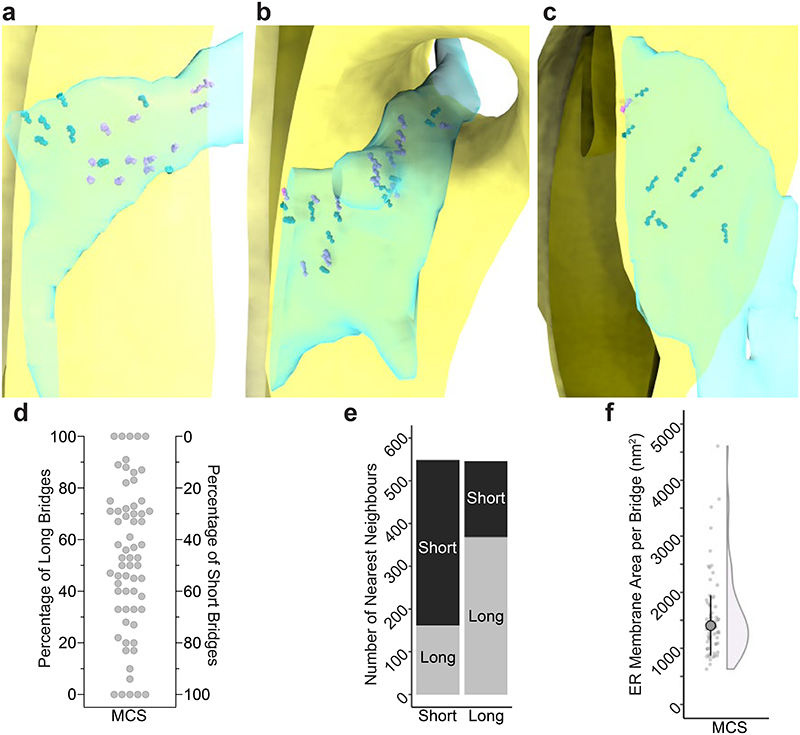
Extended Data Figure 7. The distribution of bridges within the MCS ultrastructure.
a-c: Segmentation models of MCS in three different tomograms, with STA maps of short (pink) and long (teal) classes placed back to the tomographic positions of individual bridges. OMM is in yellow, IMM in mustard, and ER in transparent light blue. d: Distribution of bridges of the long and short classes, across MCS. Each dot represents one MCS (N=64), plotted according to the percentage of long (left y-axis) and short bridges (right y-axis) it contains. e: Distribution of bridges of the long and short classes, within MCS. The number of short (left bar) and long (right bar) bridges that have a nearest neighbour belonging to the long (light grey bar fraction) and short (dark grey bar fraction) class. f: Dot plot and half-violin plot of the surface area of the ER membrane serviced by one ERMES bridge, determined per MCS. Large point indicates median, vertical lines indicate MAD. One outlier is not shown but included in median and MAD determination. N=63 MCS from 49 tomograms.

