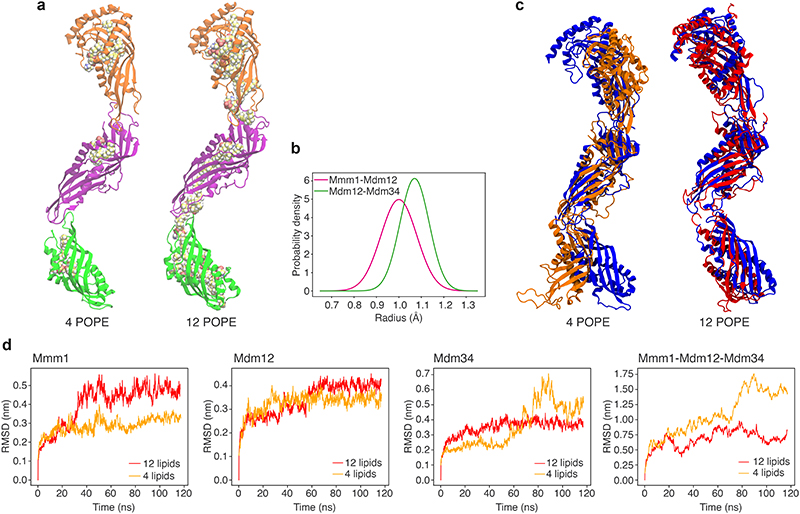
Extended Data Figure 9. Effect of bound lipids on the ERMES complex model.
a: Model of the Mmm1-Mdm12-Mdm34 complex obtained by MDFF when the starting complex contained 4 POPE lipid molecules (left) as compared to 12 POPE molecules (right). Note that the MDFF-derived model with 4 POPE molecules is also shown in Fig. 4a, b and d as well as in Extended Data Fig. 8e (g_scale=0.3), without visualisation of the lipids. b: Distributions of detected cavity radii at the interfaces between subunits Mmm1-Mdm12 (magenta) and Mdm12-Mdm34 (green). The radii were computed from frames taken over the last 100 ns of the MDFF simulation and are shown as probability density distributions. c: Structural comparison between the heterotrimeric complex obtained by MDFF with the STA map (blue), and the same complex after an additional unbiased MD simulation of 120 ns. The left model is with 4 lipids bound, the right model with 12 lipids bound. d: Root mean square deviations (RMSD) of individual subunits and of the heterotrimeric complex, measured over the additional 120 ns unbiased MD simulations of the MDFF-obtained heterotrimeric complex with either 12 or 4 lipids bound (red and orange, respectively). The end points (120 ns) of the red and orange plots correspond to red and orange conformations of the complex shown in d, respectively. The differences in the RMSD of Mmm1 with 12 vs. 4 lipids can be attributed to its N-terminal region, see also Supplementary Fig. 2.

