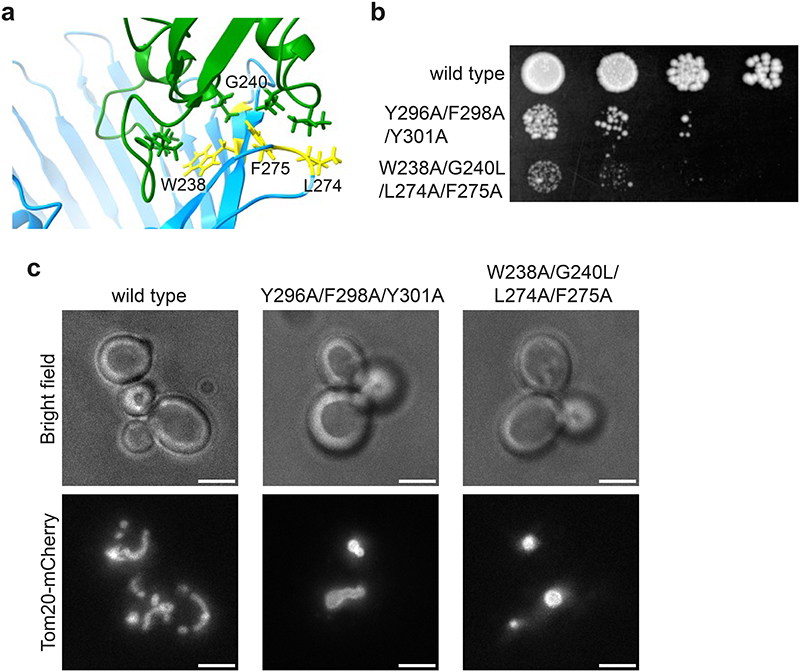
Extended Data Figure 10. Mdm10 mutation in the predicted Mdm10-Mdm34 interface.
a: MDFF-derived predicted interface between Mdm10 (blue) and Mdm34 (green). Residues in wild type Mdm10 that were mutated to Mdm10W238A/G240L/L274A/F275A to disrupt the interface are indicated in yellow. The mutated residues are not involved in known interactions within the SAM complex20,79. b: Spot growth assay on YPD, comparing wild type, Mdm10Y296A/F298A/Y301A (shown before to disrupt the interface between Mdm10 and Mdm3420) and Mdm10W238A/G240L/L274A/F275A. All three strains express Tom20-Cherry. c: Light microscopy of strains expressing wild type and mutant Mdm10. Tom20-mCherry is used as an indicator of mitochondrial morphology. Mdm10Y296A/F298A/Y301A and Mdm10W238A/G240L/L274A/F275A display a similar mitochondrial phenotype, indicative of ERMES complex disruption4,20. Scale bars are 3 μm. See also Supplementary Fig. 3.

