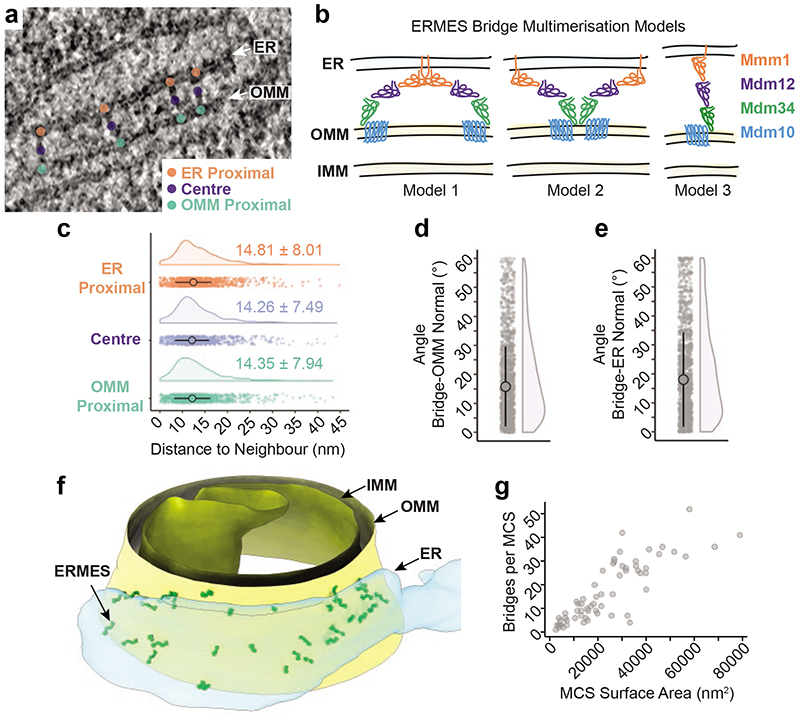
Figure 3. Supramolecular organization of ERMES within MCS.
a Coordinates of ER membrane anchor points (orange), centre points (purple) and OMM anchor points (green) in electron cryo-tomograms. b: Three possible models of how ERMES bridges could be arranged relative to each other, consistent with the STA map. Model 1: ERMES dimerizes via Mmml as observed in vitro14,16; ER anchor points of neighbouring bridges would be close to each other. Model 2: ERMES dimerizes via Mdm3414 or Mdm10; OMM anchor points of neighbouring bridges would be close to each other. Model 3: Neither model 1 nor 2 applies if neighbouring bridges are similarly close at the ER, the bridge centre and the OMM. c: Dot plot and half-violin plot of the distances between nearest neighbouring bridges, measured between the ER anchor points (orange), the bridge centres (purple), and the OMM anchor points (green), respectively. Large point indicate medians, vertical lines MAD, both also given as numerical values (N=1095 bridges from 49 tomograms) d: The angle by which each bridge is tilted relative to the OMM normal. Dot plot and half-violin plot. Large point indicates median, vertical lines MAD (N=1098 bridges from 51 tomograms). e: The angle by which each bridge is tilted relative to the ER membrane normal. Dot plot and half-violin plot. Large point indicates median, vertical lines MAD (N=1098 bridges from 51 tomograms). f: Segmentation model of an electron cryo-tomogram, showing the distribution of ERMES bridge structures within MCS. The STA map was placed at the positions of individual bridge structures, indicated as ERMES. OMM, IMM and ER are also indicated. g: The number of bridges per MCS, plotted as a function of the surface area of the ER membrane in contact with the OMM (N=63 MCS from 49 tomograms).

