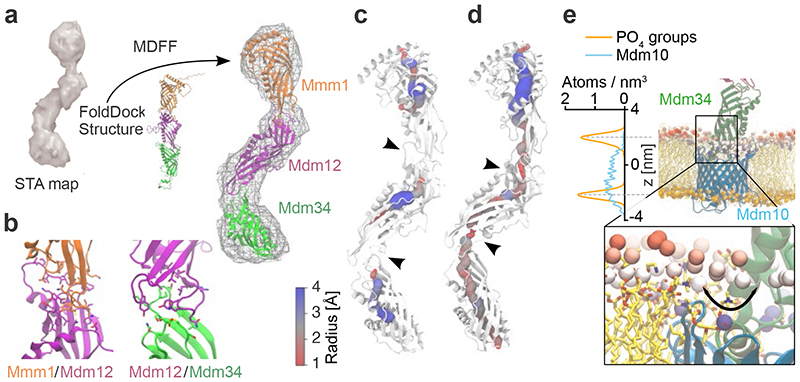
Figure 4. Integrative modelling of the ERMES complex.
a: FD and MDFF approach26,37. The STA map was used to bias the conformation of the three SMP domains of ERMES. b: Predicted interfaces between Mmm1-Mdm12 (left), Mdm12-Mdm34 (right) in the model fit to the STA map. Interfacing residues (<3 Å) are shown as sticks. c: Average cavity of the heterotrimeric ERMES model with 4 POPE molecules. The three subunits show three distinct cavities which narrow at the subunit interfaces (black arrowheads). Cavity radii are indicated by sphere size and colour. d: Average cavity of the heterotrimeric ERMES model obtained with 12 POPE molecules. A continuous tunnel across subunit interfaces (black arrowheads) is observed as compared to c. The cavity is shown as an average of trajectory snapshots in which a full tunnel connects the two extremities of the complex (approximately 7% of total trajectory snapshots). Cavity radii are indicated by sphere size and colour. e: Hydrophobic mismatch of Mdm10 (cyan) embedded in an OMM-like bilayer. Phosphate groups of the upper leaflet are coloured according to their position along the z-axis (range: 10-25 Å from the bilayer centre, scale: blue to red). Left: Density profiles of the Mdm10 backbone (cyan) and membrane phosphate groups (orange), averaged over last 100 ns of the MDFF simulation. Inset: Close-up representation of the Mdm34-Mdm10 interface. Phosphate groups are represented as large Van der Waals spheres. Black arrow indicates nearness of Mdm34 cavity to phosphate groups

