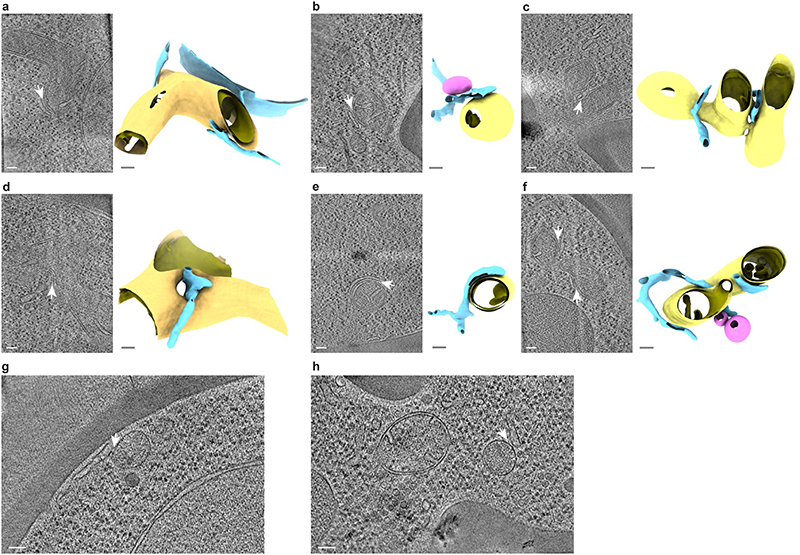
Extended Data Figure 2. MCS imaged by cryo-ET at Mdm34-mNeonGreen signals.
a-f: Diversity of membrane morphologies of ER-mitochondria MCS imaged by cryo-ET at locations of Mdm34-mNeonGreen. Six representative examples from a data set of 51 tomograms are shown. Left panels are virtual slices through electron cryo-tomograms. ER-mitochondria MCS are indicated by white arrows. Right panels are segmentation models of the ER (blue), the OMM (yellow), the IMM (mustard) and peroxisomes (pink). The segmentation models are rotated relative to the virtual slices to better visualize the MCS. The example in e is the same as shown in Fig. 3e. g, h: ER-peroxisome contacts imaged by cryo-ET at locations of Mdm34-mNeonGreen. Approximately 15% of Mdm34-mNeonGreen puncta contained ER-peroxisome MCS (indicated by white arrows) rather than ER-mitochondria MCS. Peroxisomes are identified as spheroid single-membrane vesicles more than 100 nm in diameter with dense interior77,78. Scale bars are 100 nm. Note that due to the perspective view, scale bars in the panels showing segmentation models apply only to the front plane of the scenes.

