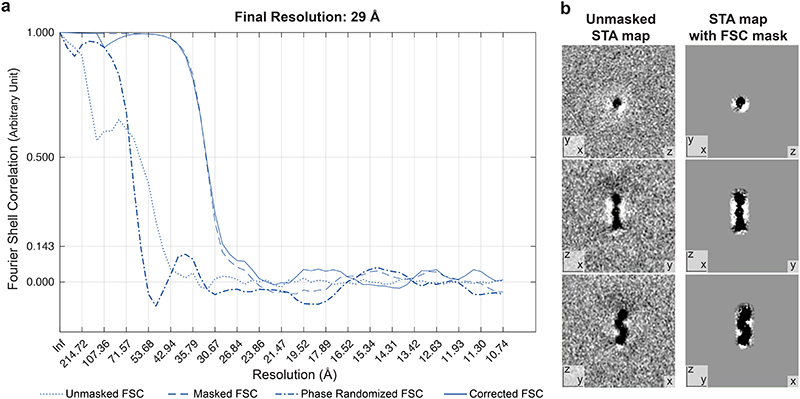
Extended Data Figure 4. Resolution estimate of STA map.
a: Fourier shell correlation, calculated according to59. The final resolution corresponds to FSC=0.143. b: Left panel: Three virtual slices through the unmasked STA map. Right panel: Three virtual slices through the STA map masked for FCS calculation.

