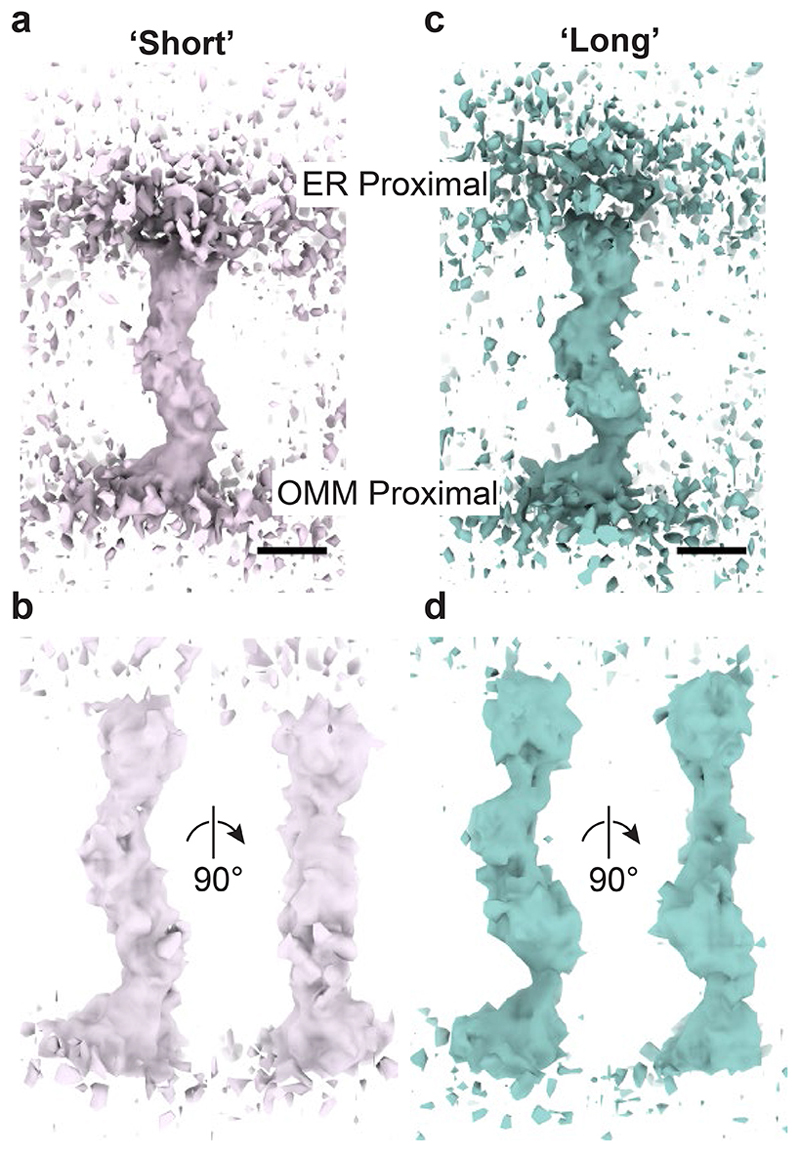
Extended Data Figure 5. STA maps of short and long bridges.
a, b: STA map of short class (pink). c, d: STA map of long class (teal). The two classes were obtained by halving the data set of 1098 bridge structures according to bridge length and subjecting both classes separately to the procedure shown in Extended Data Fig. 3. In a and c the maps are shown at lower contour levels than in b and d. Scale bars are 5 nm. Note that due to the perspective view, scale bars apply only to the front plane of the scenes.

