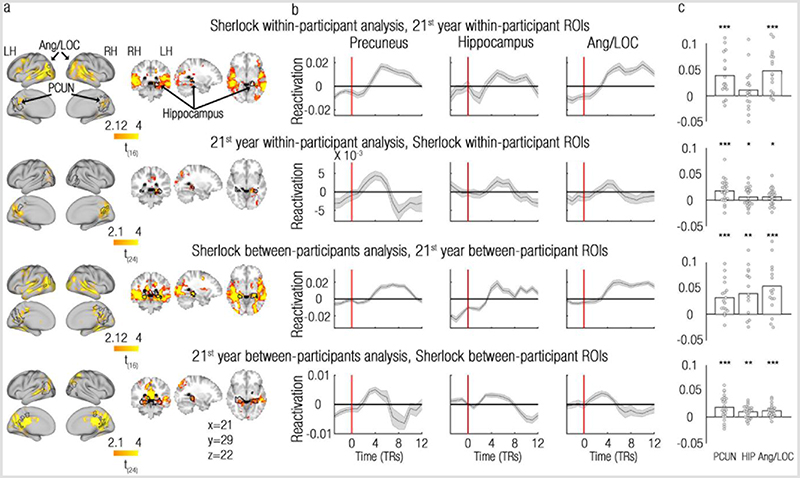
Figure 4. Reactivation is specific to event-boundaries − replication across datasets.
(a) Group maps of each dataset (Sherlock/21st year) superimposed with the ROIs defined from the other dataset, using the same analysis method (within/between-participant analysis). For example, in the first row, the within-participant reactivation group map of the Sherlock dataset (Figure 2a, 1st row) is superimposed with ROIs defined from the within-participant reactivation group map of the 21st year dataset (Figure 2a, 2nd row). (b) Group-averaged reactivation indices derived from the ROIs in (a) are presented for the time period of 3 TRs prior to event boundaries until 12 TRs after event boundaries, uncorrected for the HRF delay. Event boundaries are depicted as red vertical lines. Grey error bands represent SEMs. (c) ROI analysis used to quantify the significance in (b). Reactivation indices are derived from each of the datasets and ROIs presented in (a) and TRs 1-6 (minus baseline) presented in (b). Single-participant values are represented as circles and group means are represented as bars. n=17/25 participants for the Sherlock/21st year datasets, respectively, see sup. Table 1 for exact p-values. PCUN, Precuneus/retrosplenial cortex; Ang/LOC, Angular gyrus/Lateral Occipital Cortex; HIP, Hippocampus. *p<0.05; ** p<0.01; *** p<0.001, two-sided permutation tests.

