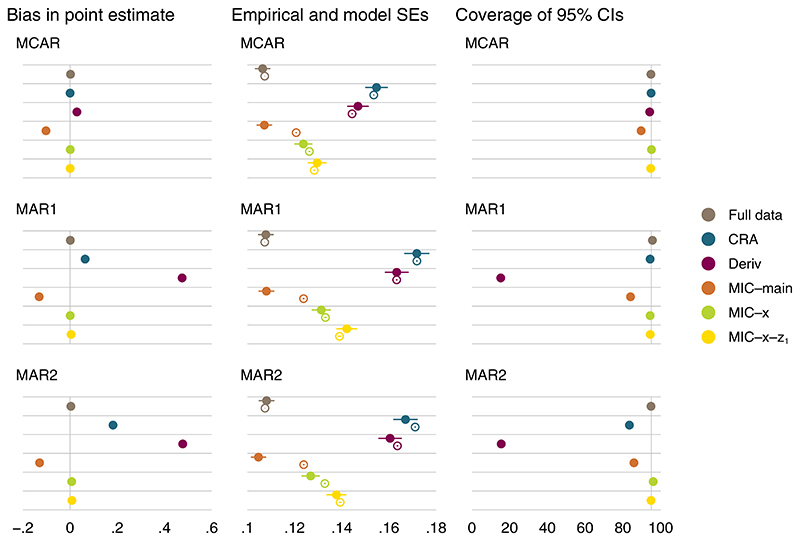
Figure 2.
Simple composite endpoint, case I: performance measures for under different missingness mechanisms of the components; βx = 1.35. Error bars, ±1.96× Monte Carlo errors; filled and hollow points, empirical and average model standard errors, respectively; vertical lines at 0 and 95 for bias and coverage, respectively [Colour figure can be viewed at wileyonlinelibrary.com]

