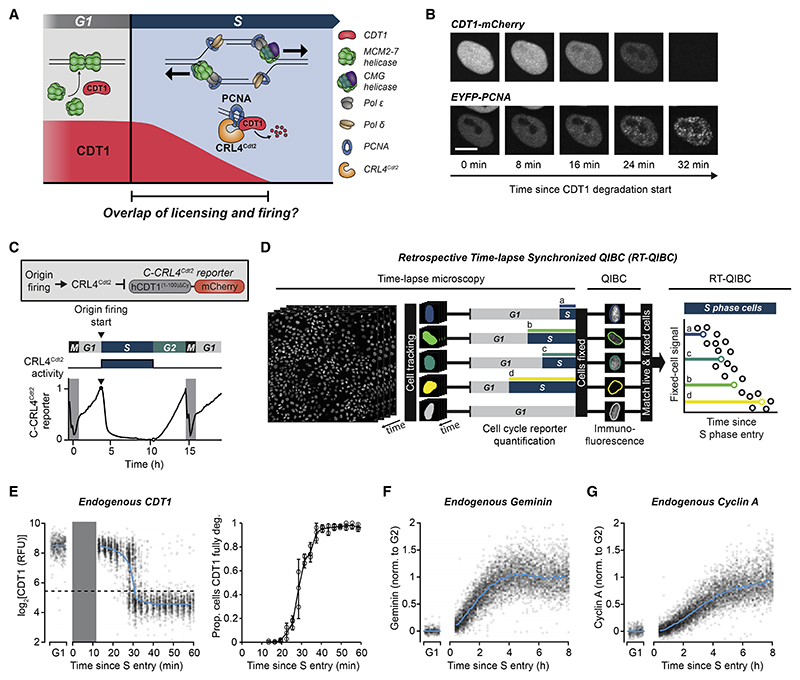
Figure 1. Active CDT1 is present together with fired origins in early S phase.
(A) Predicted overlap between CDT1 and origin firing in early S phase.
(B) MCF10A cells expressing EYFP-PCNA and doxycycline-inducible CDT1-mCherry, induced 6 h before imaging. Representative of 54 cells. Scale bars, 10 μm. Quantification in Figures S1A–S1C and expression in Figure S1F.
(C) Top: live-cell reporter of CRL4Cdt2 activity. Bottom: example trace of C-CRL4Cdt2 reporter in a single MCF10A cell. Reporter is degraded at S entry.
(D) Diagram of retrospective time-lapse synchronized QIBC (RT-QIBC). Time-lapse microscopy of H2B-mTurquioise and QIBC of CDT1 immunofluorescence (IF). (E–G) RT-QIBC aligned to S entry (C-CRL4Cdt2 reporter degradation). G1 cells are 1–2 h after anaphase. Solid blue curves are median value. Representative of 3 independent experiments.
(E) Left:CDT1 IF(n = 3,710 Scells, 500G1 cells). Dashed line is threshold for fully degraded CDT1. Gray bar is period that is not observed due to the requirement of 12 min of reporter degradation to identify S entry. Right: quantification of left. Proportion of cells with fully degraded CDT1 over time within 3 min bins for 3 experiments (n ≥ 36 cells per point). Error bars are 95% confidence intervals.
(F) Geminin IF (n = 13,262 S cells, 300 G1 cells).
(G) Cyclin AIF(n = 13,262 S cells, 300 G1 cells).
See also Figures S1 and S2.

