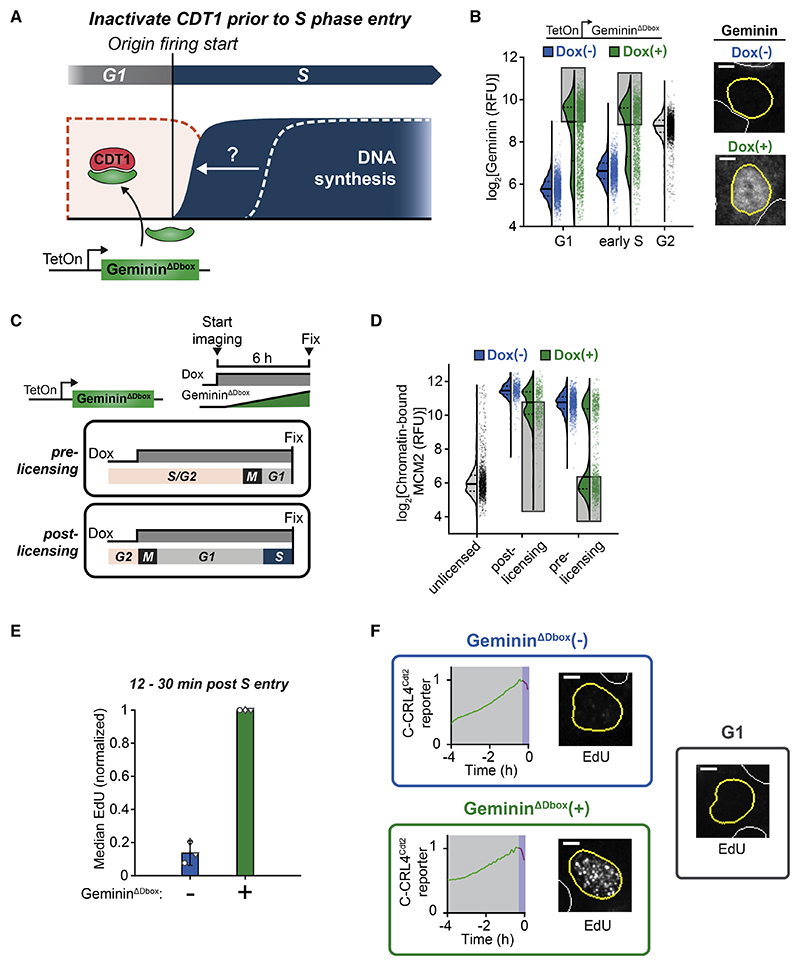
Figure 4. CDT1 suppresses DNA synthesis during the overlap period of licensing and firing.
(A) Prematurely inactivating CDT1 with doxycycline (Dox)-inducible GemininΔDbox in G1 to accelerate the start of DNA synthesis.
(B-D) RT-QIBC in MCF10A cells with GemininΔDbox induced during live-cell imaging of C-CRL4Cdt2 reporter. Dashed and solid lines in violin plots are IQR and median. Representative of 2 (D) or 3 (B) independent experiments. Scale bars, 5 μm.
(B) Geminin immunofluorescence (detects geminin and GemininΔDbox). Left: G1 (1–2 h post anaphase), S (≤0.5 h in S) and G2 (4N DNA, EdU(−), no Dox). Shaded area is upper 50% of cells, which induce GemininΔDbox higher than median G2. n ≥ 1,316 cells per condition. Right: example cells 1 h in G1.
(C) Cells were identified in two groups. Pre-licensing: Dox added ≥5 h before mitosis, and fixed ≤1 hinG1. Post-licensing:Dox was added ≤1 hbefore mitosis and fixed ≤ 1 h in S.
(D) Pre-extracted cells. MCM2 from unlicensed cells was estimated from G2 MCM2 signal (4N DNA and PCNA negative). Shaded area is lower 50% of cells, corresponding to cells in shaded bar in Figure 4B. n ≥ 434 per condition.
(E and F) RT-QIBC in post-licensing Dox addition MCF10A cells. EdU added 30 min before fixation. Cells that were in S phase for 12–30 min and had not fully degraded CDT1 were analyzed. GemininΔDbox (+) cells selected based on Geminin stain.
(E) For each of 3 independent experiments, the median of cells was taken (n ≥ 31 cells per replicate per condition; GemininΔDbox (−): 120 cells total; GemininΔDbox (+): 213 cells total) and normalized to GemininΔDbox (+) condition. Error bars are mean ±2 × SEM (GemininΔDbox (−) cells are 13.6% ± 7.4% of GemininΔDbox (+) cells). See Figure S5G for estimated absolute quantification.
(F) Representative EdU images and matching C-CRL4Cdt2 traces (magenta trace represents time following S entry). GemininΔDbox (−) and GemininΔDbox (+) cells 17.2 and 16.9 min in S phase. Scale bars, 5 μm.
See also Figure S5.

