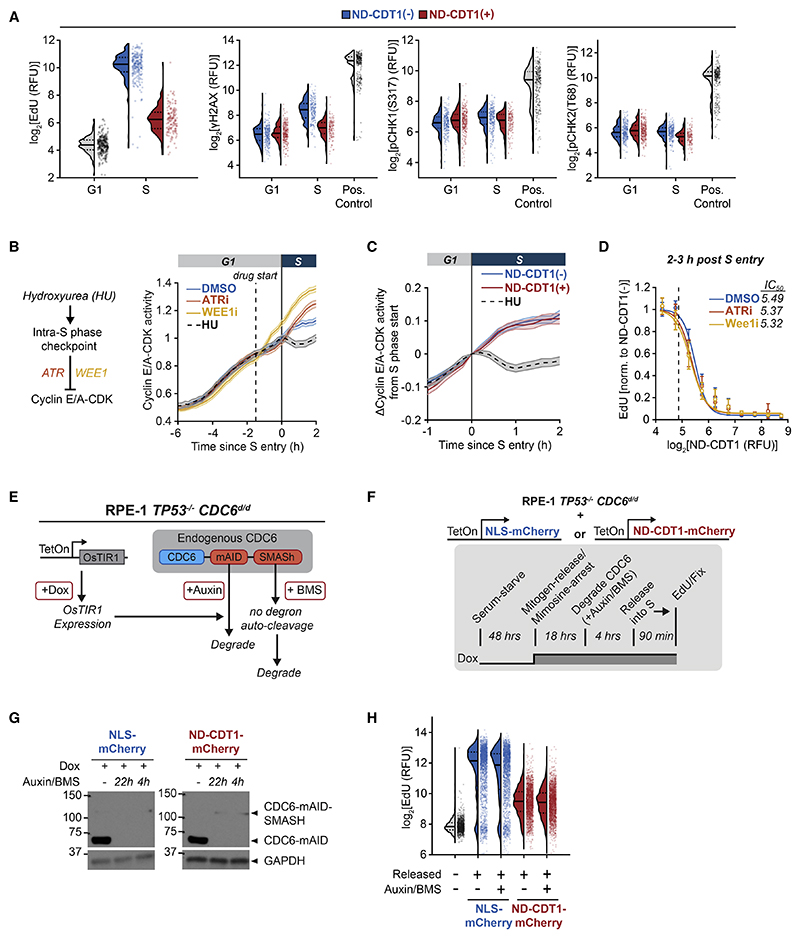
Figure 5. CDT1 inhibits DNA synthesis independently of the global intra-S-phase checkpoint and re-replication.
(A) RT-QIBC in siGeminin-treated, mitogen-released MCF10A cells. S cells were 1–2 h into S phase. Positive controls were cells treated with 1 μM MK-1775 (WEE1i) for 4 h in S cells, which caused DNA damage. n ≥ 146 cells per condition.
(B) Mitogen-released MCF10A cells. 2 μM AZ-20 (ATRi), 1 μM WEE1i, or 2 mM hydroxyurea (HU) were added to cells 14 h after release. Cells that received drug 1–2 h before S entry were analyzed (dashed line is 1.5 h). Shaded area is mean ± 2 × SEM. n = 167 (DMSO), 145 (ATRi), 239 (WEE1i), and 119 (HU) cells.
(C) Mitogen-released MCF10A cells. 2 mM HU added to HU condition 1–2 h before S entry. Shaded area is mean ± 2 × SEM. n ≥ 336 cells per condition.
(D) RT-QIBC of mitogen-released, siGeminin-treated MCF10A cells 2–3 h in S phase. 2 μM ATRi or 1 μM WEE1i were added 4 h before fixation. Error bars are mean ±2 × SEM for bins of ND-CDT1 (≥12 cells per bin, ≥770 cells per condition). Dashed line is threshold for ND-CDT1(−). Lines are fit Hill equations (fit parameters in STAR Methods).
(E) RPE-1 TP53−/− CDC6d/d cells degrade endogenous CDC6 with addition of Auxin and BMS-650032 (BMS).
(F-H) Dox-inducible ND-CDT1-mCherry or NLS-mCherry in RPE-1 TP53−/− CDC6d/d cells. Cells were mitogen-released in the presence of mimosine and doxycycline (Dox) for 18 h. CDC6 was degraded for 4 h, and then cells were released from mimosine arrest for 1.5 h, pulsed with EdU, and fixed.
(G) Western blot of CDC6 levels after acute 4 h or long-term 22 h degradation. Upper band is CDC6 with uncleaved SMASh-tag.
(H) QIBC of EdU in cells with inactive APC/CCdh1. NLS-mCherry/ND-CDT1-mCherry-positive cells were chosen based on gates Figure S5M. n = 1,120 cells (unreleased), 2,000 cells (other conditions).
Dashed and solid lines in violin plots are IQR and median. Data representative of 2 independent experiments.
See also Figure S5.

