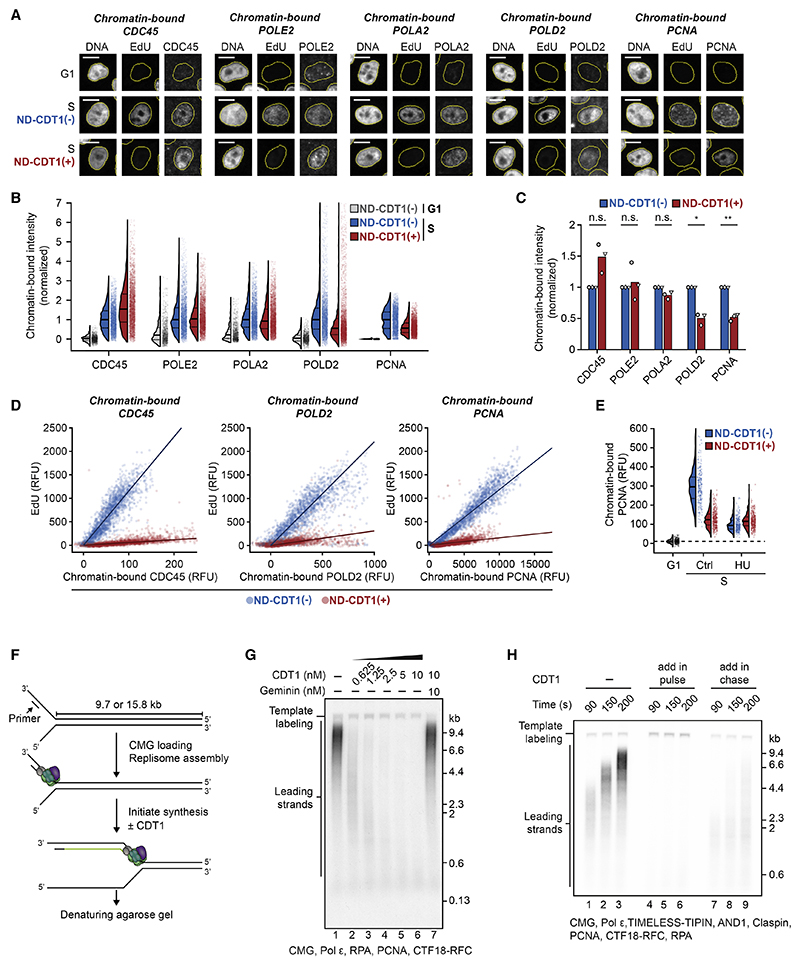
Figure 6. CDT1 inhibits replication fork elongation while permitting origin firing.
(A–E) RT-QIBC of chromatin-bound replisome components in mitogen-released MCF10A cells. G1 and S cells were identified (see STAR Methods). Analysis for additional proteins in Figures S6A–S6E.
(A) Representative images of EdU and CDC45, Pol ε (POLE2), Pol α (POLA2), Pol δ (POLD2), and PCNA. Scale bars, 10 μm.
(B) G1 mode intensities were subtracted off signals, and values were normalized to ND-CDT1(−) median. n = 2,000 cells per condition.
(C) Summary of median values from 3 independent experiments of Figure 6B. One-sample Student’s t test: p values CDC45(n.s.): 6.94 × 10⁻², POLE2 (n.s.):.693, POLA2 (n.s.): 6.41 × 10⁻², POLD2 (*): 1.21 × 10⁻², PCNA (**): 4.3 × 10⁻³.
(D) EdU vs. replisome components in S cells. Fit line from linear regression (n = 2,000 cells per condition).
(E) Cells were treated with 2 mM hydroxyurea (HU) during final 4 h of imaging and then fixed. Dashed line is median G1 signal. n ≥ 281 cells per condition.
(F) CMG is loaded onto forked DNA template, replisome is assembled, and replication is initiated in the presence or absence of CDT1. Synthesized DNA is radiolabeled for visualization (green strand).
(G) Denaturing agarose gel analysis of 6 min replication reactions (15.8 kbp DNA template) with indicated proteins. 10 nM geminin was pre-incubated with equimolar CDT1 where indicated. CMG-independent template labeling is marked.
(H) Denaturing agarose gel analysis of pulse-chase experiment (15.8 kbp DNA template) with the indicated proteins. Synthesized DNA was labeled in pulse, and chase was added after 50 s. 10 nM CDT1 was added with pulse or chase.
Dashed and solid lines in violin plots are IQR and median. Data representative of 3 independent experiments.
See also Figure S6.

