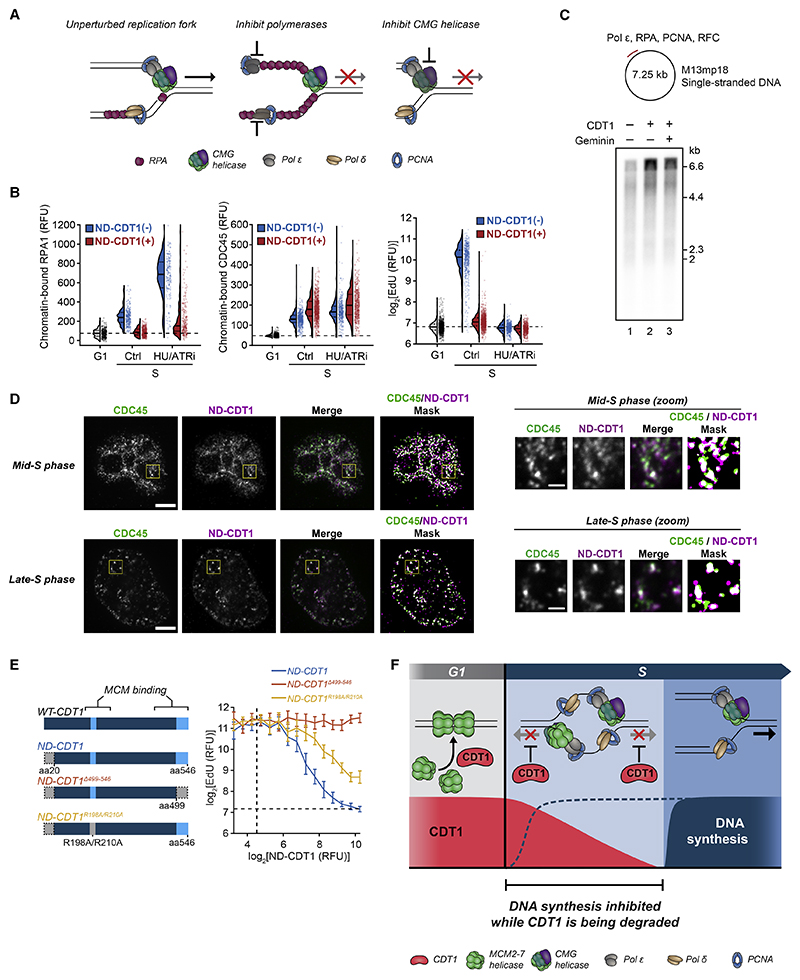
Figure 7. CDT1 inhibits CMG helicase through its MCM-binding domains.
(A) Mechanisms underlying inhibited replication fork progression.
(B) Mitogen-released MCF10A cells were treated with 2 mM hydroxyurea (HU) and 2 μM AZ-20 (ATRi) during the final 4 h. G1 and S cells were identified (see STAR Methods). n ≥ 182 cells per condition. Dashed line is G1 signal median. Representative of 3 independent experiments.
(C) Top: polymerase epsilon primer extension assay (M13mp18 circular single-stranded DNA template). Bottom: denaturing agarose gel analysis of 15 min primer extension reactions. 10 nM CDT1 pre-incubated with equimolar geminin where indicated. Representative of 3 independent experiments.
(D) CDC45-GFP U2OS cells with doxycycline (Dox-inducible ND-CDT1 were treated with Dox for 8 h, pre-extracted, and co-stained for ND-CDT1(anti-HA-tag) and CDC45 (anti-GFP). Mid- or late-S-phase cells identified by CDC45 pattern. Signals were masked by thresholding. Yellow box is zoomed region. Representative of 35 (mid S) or 18 (late S) cells. Scale bars, 5 μm (full image) and 1 μm (zoom). Co-localization analysis in Figure S7B.
(E) Left: MCM-binding region mutants of ND-CDT1. WT-CDT1, wild-type CDT1. Right: dose responses of EdU to ND-CDT1 (anti-HA-tag), 1–2 h after S entry in mitogen-released siGeminin-treated MCF10A cells. Error bars are mean ± 2 × SEM(n ≥ 26 cells per bin, n ≥ 1,048 cells per condition). Dashed lines are negative threshold. Mutant expression in Figure S7C.
(F) Diagram of CDT1 regulation of DNA synthesis in early S.
See also Figure S7.

