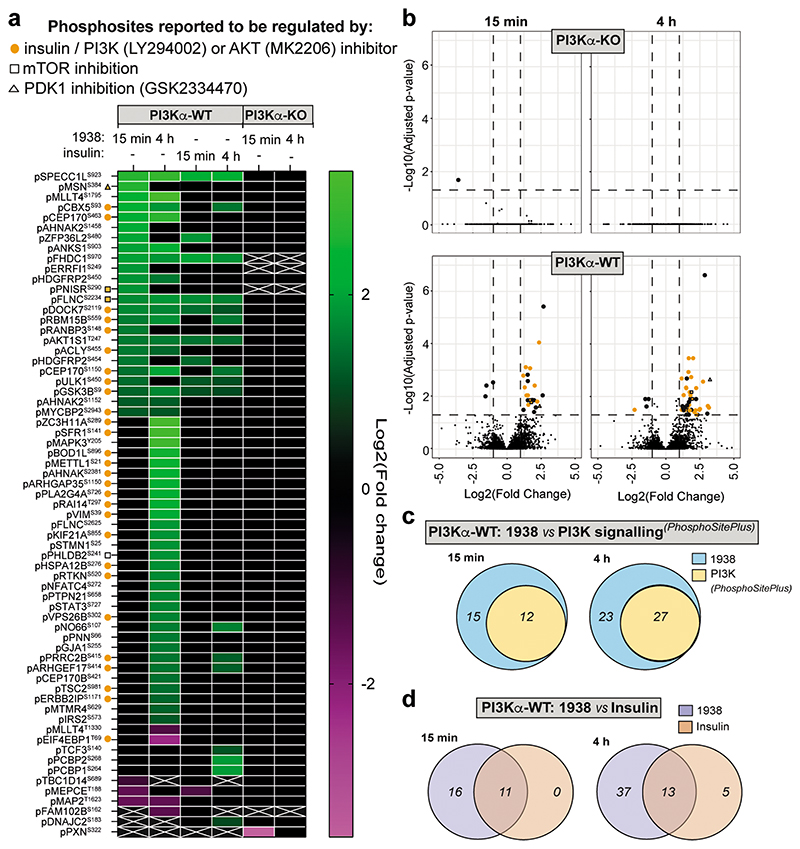
Fig. 4. Phosphoproteomic analysis of PI3Kα-WT and PI3Kα-KO MEFs.
stimulated with 1938 (5 μM) or insulin (100 nM) for 15 min or 4h (n=4 independent experiments). a, Heat map: phosphosites significantly altered by stimulation relative to DMSO treatment. Green boxes, significantly upregulated phosphosites; magenta boxes, significantly downregulated phosphosites; white crosses: phosphosites not detected in a comparison. b, Volcano plot of phosphosites differentially regulated by 1938 (5 μM) in PI3Kα-WT or PI3Kα-KO MEFs, relative to DMSO-treated cells of the same genotype. Note that the PI3Kα-WT volcano plots have been reproduced in enlarged format with labeling of individual proteins and phosphosities in Extended Data Fig. 7c. c, Venn diagram showing overlap of the number of phosphosites significantly regulated by 1938 in PI3Kα-WT MEFs with sites that have been identified previously and are annotated in PhosphoSitePlus47 as regulated by insulin, IGF-1, LY294002 (pan-PI3K inhibitor) or MK2206 (AKT inhibitor). d, Venn diagrams showing the overlapping number of phosphosites regulated by 1938 and insulin in PI3Kα-WT MEFs.

