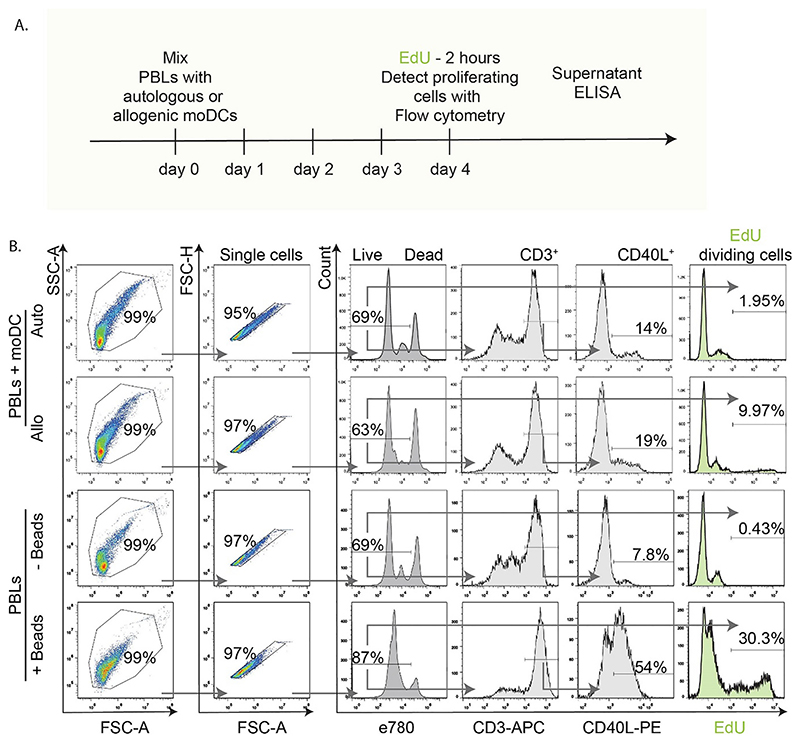
Fig. 2. EdU-based detection of proliferating T cells and flow cytometry gating.
A. Scheme of MLR experiments as in Fig. 1A, with the difference that cell loading with EdU was performed on day 4; two hours prior to fixation and analysis. B. Flow cytometry gating strategy used for the MLR with autologous (Auto) or allogenic (Allo) pairs of PBLs and moDCs or for the PBLs activated with anti-CD3 anti-CD28 beads (+/-Beads). Cells were selected based on forward and side scatter, followed by exclusion of cell clumps (single cells). Next, dead cells were excluded by selecting cells with low eFluor780 intensity using the same gate as for the CellTrace samples. Live cells were analyzed for CD3, CD40L and EdU incorporation (detected by bioorthogonal click-chemistry). An EdU histogram intensity shift towards the right indicates proliferating cells. Arrows show gating order. Experiments were performed with cells isolated from 4 donors; quantification in Fig. 3.

