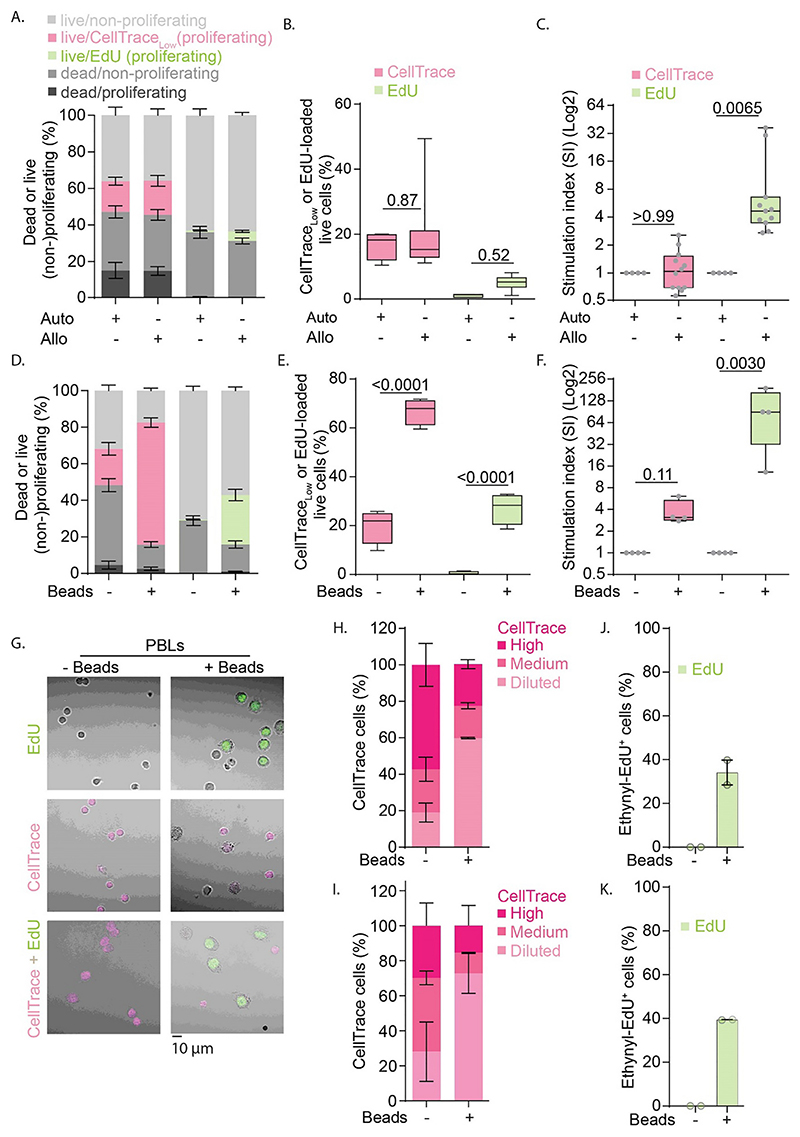
Fig. 4. Assessment of PBL proliferation in experiments with CellTrace and EdU.
A. Quantification of live, dead and proliferating and non-proliferating cells detected for MLR with autologous (Auto) or allogenic (Allo) pairs of PBLs and moDCs with CellTrace (pink) and EdU (green). B. Quantification of live proliferated cells. C. Normalization of MLR shown in panel B to the autologous conditions for each individual donor. D—F. Same as panels A-C, but now for PBLs stimulated with anti-CD3 anti-CD28 beads (+/-Beads). G. Representative confocal images of bead-stimulated PBLs. Cells were labeled with EdU (green), CellTrace (pink), or both. Scale bar, 10 μm. HK—. Quantification of fluorescence signals from panel G for experiments with only CellTrace (H.), only EdU (J.) and both (IK—.). For the CellTrace fluorescence (panels H and I), the signals were differentiated with manual thresholds in three categories: Diluted, Medium, and High. Experiments were performed with cells isolated from either 4 donors (panels A-F) or two donors (G-K). All box plots represent mean, min and max values. Bar graphs represent mean ± SEM. P-values were evaluated with one-way ANOVA (B, E) followed by Sidak’s post-hoc test or Kruskal-Wallis test on normalized data (C, F). For confocal imaging ~180 cells per condition were analyzed. (For interpretation of the references to colour in this figure legend, the reader is referred to the web version of this article.)

