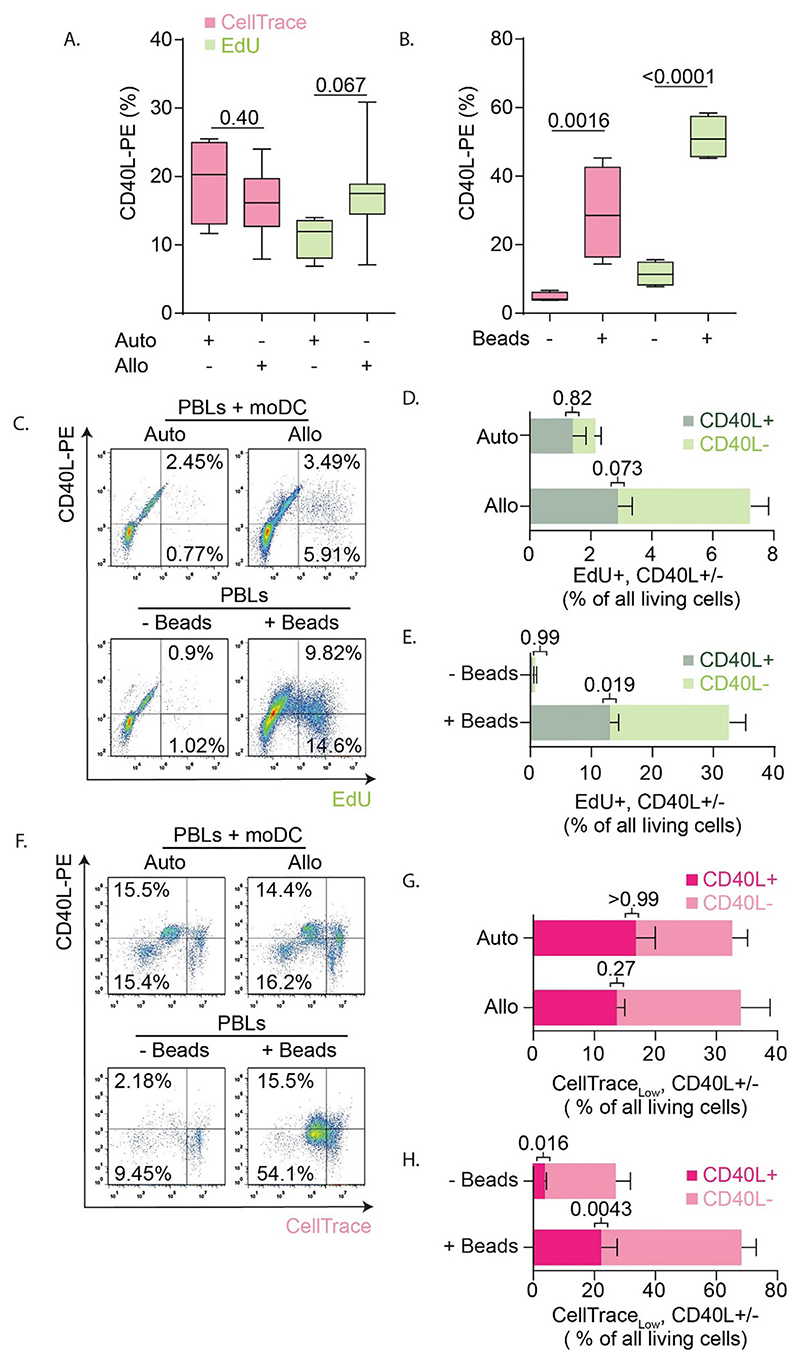
Fig. 5. Expression of T cell activation marker CD40L in experiments with CellTrace and EdU.
A-B. Quantification of CD40L expression for the MLR with autologous (Auto) or allogenic (Allo) pairs of PBLs and moDCs (A.), and for the anti-CD28 anti-CD3 bead-activated PBLs (+/-Beads) (B.) for the CellTrace (pink) and EdU (green) experiments. C. Scatter plot with flow cytometry gating strategy on the living cells from Fig. 2B with EdU (x-axis) and CD40L-PE (y-axis) for MLR (top row) and bead-stimulation (bottom row). D. Quantification of panel C for MLR reaction where the percentages of EdU+/CD40L+ and EdU+/CD40L− T cells are quantified. E. Same as panel D, but now for bead-activated PBLs. F—H. Gating strategy and quantifications of CellTracelow/CD40L+ and CellTracelow/CD40L− T cells for the CellTrace experiments. For all panels, experiments were performed with cells isolated from 4 donors. All box plots represent mean, min and max values. P-values were evaluated with one-way ANOVA followed by Sidak’s post-hoc test. (For interpretation of the references to colour in this figure legend, the reader is referred to the web version of this article.)

