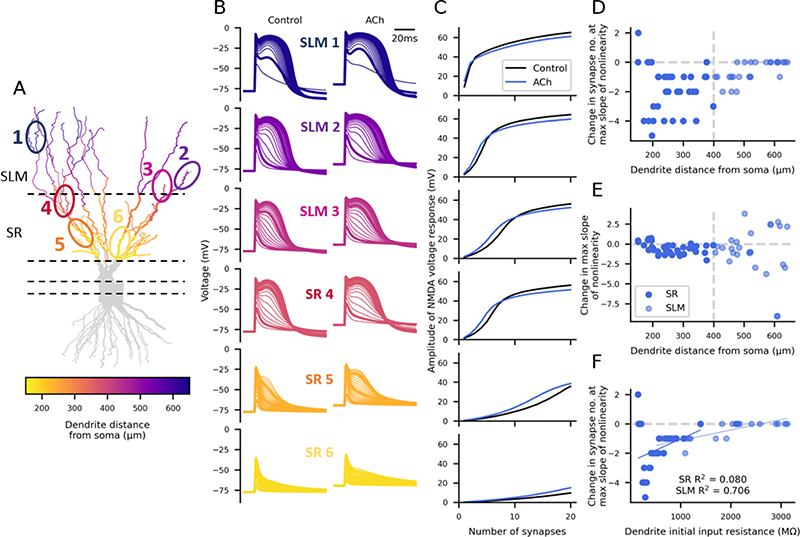
Figure 5. Acetylcholine boosts nonlinear synaptic integration in most dendrites.
(A) Morphology of the reconstructed CA3 neuron model. Coloured dendrites are the ones included in the generation of the plots in D and E. The circled and numbered sections represent the voltage plot examples and nonlinear curves in B and C. (B) Example dendritic voltage traces of increasing synapse numbers in different dendrite sections recorded in the stimulated dendrite (left) and then with simulated acetylcholine (right). (C) Nonlinearity curves for control (black) and acetylcholine (blue) for each example dendrite in B. (D) The change in number of synapses at the maximum slope of nonlinearity with acetylcholine for all SR and SLM dendrites. (E) The change in the maximum slope of nonlinearity with acetylcholine for all the SR and SLM dendrites. (F) Relationship between the initial dendritic input resistance and the effect of acetylcholine on the number of synapses at the maximum slope of nonlinearity across all dendrites.

