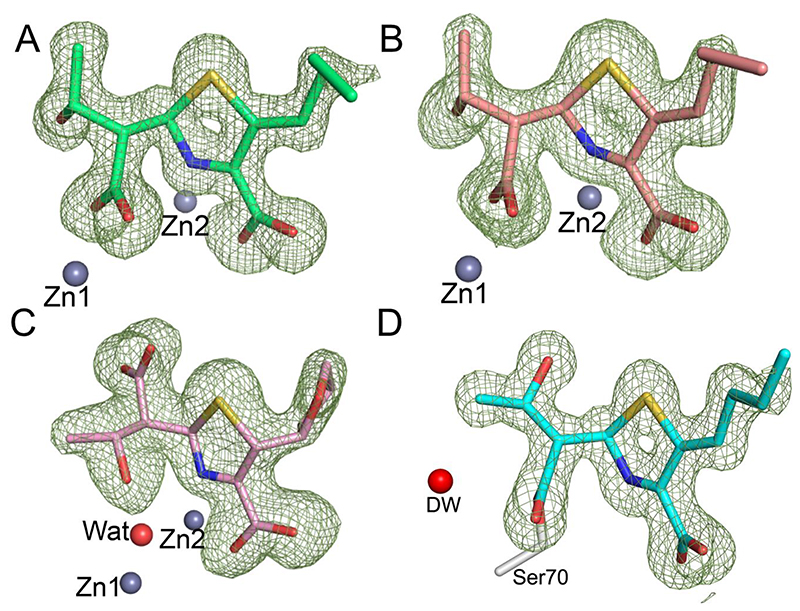
Figure 4. Faropenem derived complexes in the β-lactamase active sites as defined by electron density maps.
Views from the β-lactamase active sites, with the Fo-Fc electron density (green mesh, contoured at 3σ) calculated from the final model after removal of the ligand. (A) VIM-2, in the I222 space group (green, PDB code 7A5Z). (B) VIM-2 in the C2 space group (light red, PDB code 7A60). (C) L1 (pink, PDB code 7A63) and (D) KPC-2 (cyan, PDB code 7A61). The deacylating water (DW) is shown as a red sphere. Note the different conformations of the β-lactam derived carboxylate and hydroxyethyl groups in L1 compared to VIM-2 and the presence of the zinc bridging water with L1 (Wat, red sphere), but not VIM-2. No density was observed for the hydroxyl of the fragmented THF ring so it was omitted from the final models of the VIM-2 and KPC-2 complexes.

