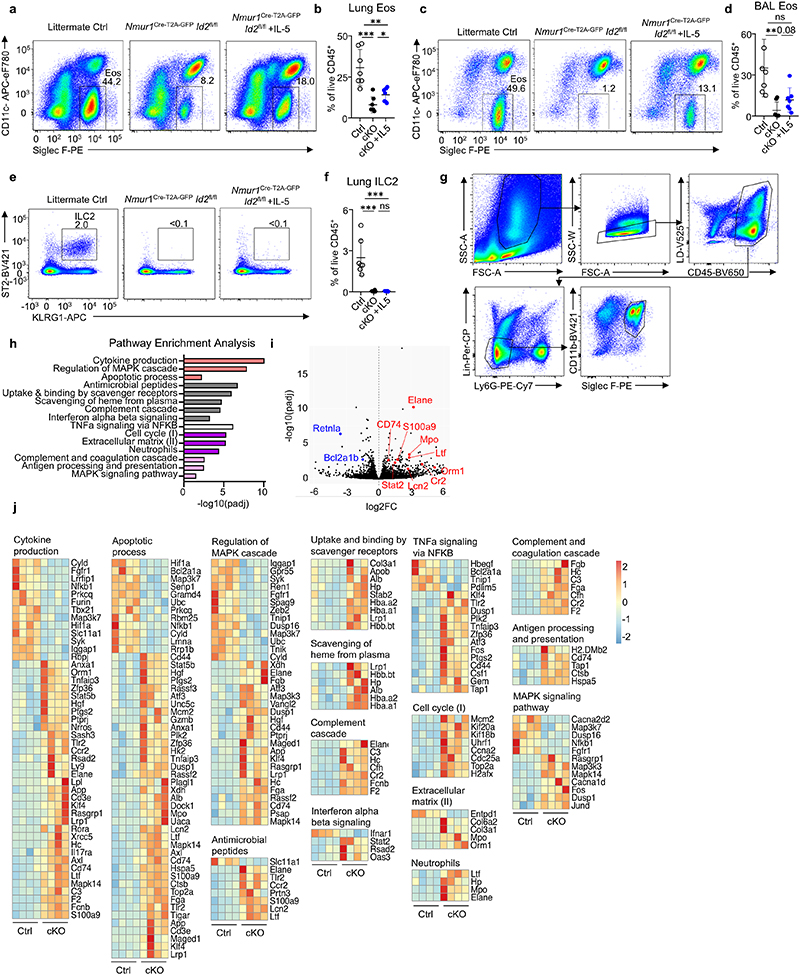
Extended Data 8 (related to Figure 3). Eosinophils are altered in ILC2-deficient mice.
a-f, Flow-cytometric analysis of eosinophils and ILC2s in the BAL and lung interstitium of Id2flox/flox, Nmur1Cre-T2A-GFP Id2flox/flox mice treated with either PBS or recombinant IL-5, seven days after allergy induction by intranasal application of Alternaria alternata extract. a,b Eosinophils in the lung interstitium, c,d Eosinophils in the BAL, e,f ILC2s in the lung interstitium. Symbols represent data from one mouse, data are pooled from two independent experiments. Mean +/- SD, Student’s t-test, ns not significant, * p<0.05, ** p<0.01, *** p<0.001, **** p<0.0001. g Flow-cytometric plots showing the gating strategy for the analysis and sorting of eosinophils from lung after Papain treatment of Nmur1Cre-T2A-GFP Id2flox/flox mice (cKO) and littermate controls (Ctrl). Data are representative of one experiment with 5 mice per group. h, Pathways from tmod gene set enrichment analysis (GSEA) of bulk RNA sequencing from eosinophils of 4 Nmur1Cre-T2A-GFP Id2flox/flox mice vs 4 WT control animals. Bars are color-coded according to Databases: Gene Ontology (GO, red), Reactome (gray), Hallmark (white), tmod (purple), KEGG (pink). Genes differentially expressed in eosinophils after papain treatment of Nmur1Cre-T2A-GFP Id2flox/flox mice (cKO) and littermate controls (Ctrl) were used for the analysis. i, Volcano plot showing differentially expressed genes of interest in eosinophils after papain treatment of Nmur1Cre-T2A-GFP Id2flox/flox mice (cKO) and littermate controls (Ctrl) j, Heatmaps of genes differentially expressed in eosinophils after papain treatment of Nmur1Cre-T2A-GFP Id2flox/flox mice (cKO) and littermate controls (Ctrl). Each heatmap corresponds to one pathway shown in (h).

