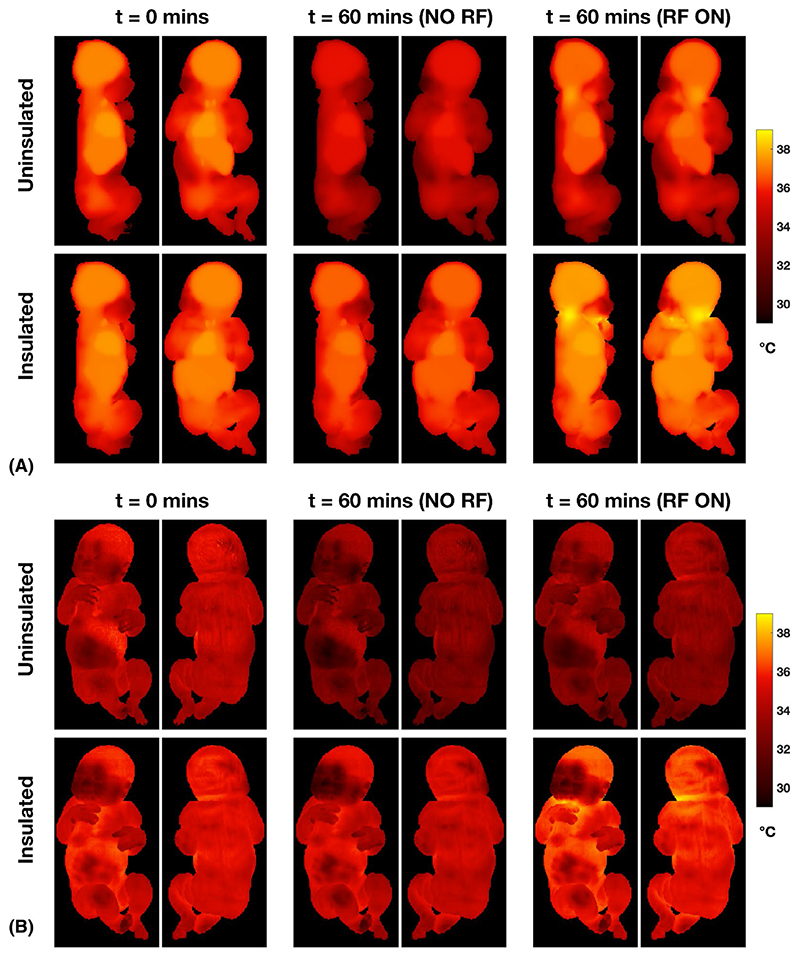
Figure 7. Temperature distributions for neonate A with and without thermal insulation (blanket).
A, Maximum intensity projections. B, Surface temperature distributions. The starting time (t = 0) was reached after 60 minutes of simulation to reach a stable starting condition. Temperature distributions after a further 60 minutes without (middle columns) or with (right columns) RF exposure are shown. Without thermal insulation or RF exposure, the neonate cools significantly. When insulated and with 60 minutes of RF exposure, higher local temperatures are reached in the posterior part of the neck, and the face/hand where these are close together, but do not exceed 39°C

