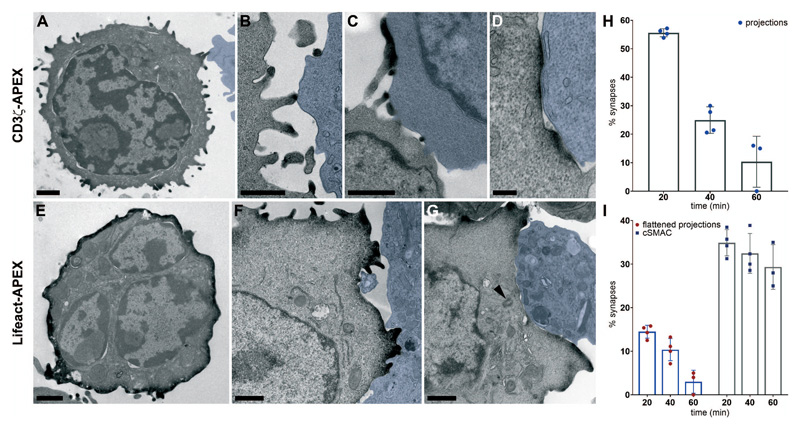
Fig. 1. CD3ζ-APEX and Lifeact-APEX localization in CTLs.
Transmission EM (TEM) images of (A to D) CTLs expressing CD3ζ-APEX incubated with target cells (blue) for 20 min showing (A and B) projections, (C) flattened projections and (D) cSMAC. (E-G) CTL expressing Lifeact-APEX with cells in (F and G) incubated with target cells (blue) for (F) 40 min and (G) 20 min; arrowhead marks centrosome. All 50-70 nm sections, except (C) 250 nm. Scale bars, 1 μm (D, 200 nm). Representative of (A) 38, (B) 42 (C) 54, (D) 67 examples from 4x or (E) 54, (F) 95, (G) 28 examples from 5 independent experiments. (H and I) Percentage of immune synapse images from CTLs and targets incubated for 20, 40 and 60 minutes showing CD3ζ-APEX in (H) projections and (I) flattened projections (red circles) or cSMAC (blue squares) from 107 (20min), 146 (40min) and 49 (60min) APEX-labeled immune synapses. Error bars show mean values ± SD from 4 independent experiments.

