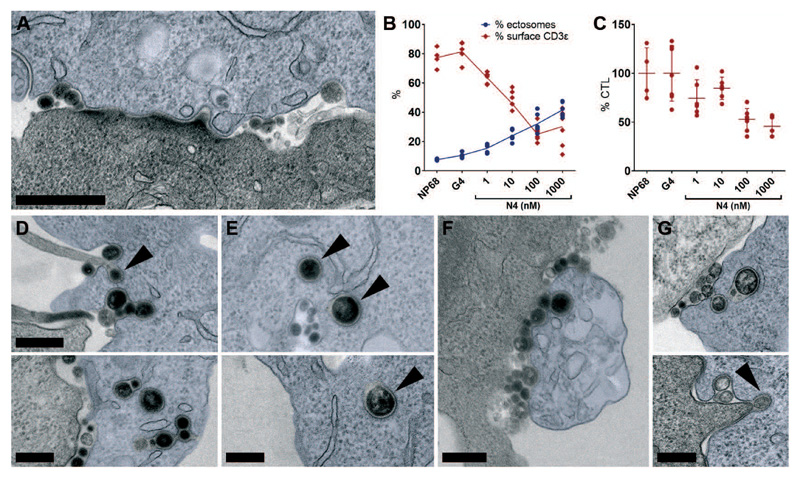
Fig. 4. Ectosomes are internalized into target cells by clathrin-mediated endocytosis.
(A) TEM image through an immune synapse with target cell in blue, showing CD3ζ-APEX ectosomes budding at the edges of membrane-clustered CD3ζ (cSMAC) causing separation of CTL and target membranes. Representative of 61 examples from 5 independent experiments. Scale bar, 500 nm. (B) Percentage CTL with CD3ε surface labeling analyzed as shown in (fig S3) (red graph), and percentage target cells decorated with transferred CD3ε-labeled ectosomes (blue graph), from CTL-target conjugates stimulated with irrelevant (NP68), weak (G4) or strong (N4) peptides. Each data point shows quantitation per 40x field from 163-358 CTL and 274-463 targets per condition, error bars show mean value ± SD from 4-5 technical replicates; representative of 3 independent experiments. (C) CTL detachment from CTL-target conjugates over 35 minutes, expressed as percentage of CTLs in NP68 sample (n = 51/field). Data sets as in B. (D to F) TEM images of CD3ζ-APEX expressing CTL showing CD3ζ-ectosomes internalized into target cells (blue) including (F) dying cells with vacuolated ER. Black arrowheads indicate clathrin coats. (G) TEM images of immune synapses between untransfected CTL and targets (blue) showing ectosomes internalized into endocytic vesicles with clathrin coats (black arrowhead). All images are from 50-70 nm sections. Representative of (D to E) 91, (F) 28 synapses from 4 independent experiments, and (G) > 50 synapses from 7 independent experiments. All CTL-target conjugates were fixed after 40 minutes or (F) 60 minutes co-incubation. Scale bars, 250 nm.

