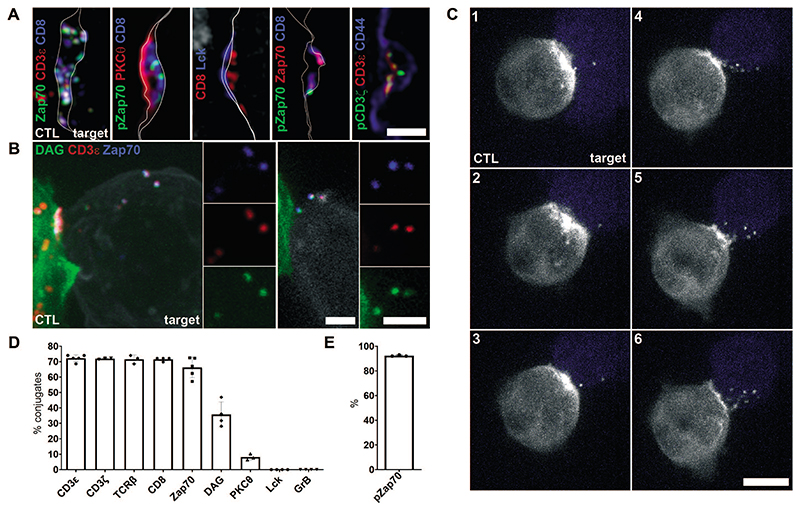
Fig. 5. Activated TCR and Zap70 are shed into ectosomes.
(A) SIM imaging showing the central area of the immune synapse between untransfected CTLs and target cells labeled with antibodies as indicated. All panels show a single section image with CTL (left) and target (right) membranes either traced in white or delineated by CD44 labeling of both CTL and target (blue). Images representative of (left to right) 72, 17, 98, 45, 25 synapses from 3-5 independent experiments. Scale bar, 1 μm. (B) Projected z-stack (left) and single (right) confocal images through synapses between CTL expressing EGFP-tagged bio-probes for DAG (PKCε, left; PKCγ-C1, right; green) and targets (white), and labeled for CD3ε (red) and Zap70 (blue). Images are representative of 29 (PKCε) and 27 (PKCg-C1) synapses across 2 and 4 independent experiments, respectively. Scale bars, 2 μm. (C) Image series from live imaging of CTLs expressing PKCε-EGFP bio-probe for DAG (white) synapsed with target cells (blue) (movie S8). All images are projections from 33 z-planes, 68 sec apart. Data is representative of 6 movies from 4 independent experiments. Scale bar, 5 μm. (D) Percentage ectosomes transferred to target cells after 35-45 minutes incubation with CTLs, analyzed by confocal microscopy with each marker as shown. Note, EGFP-tagged DAG bio-probe signal will diminish in acidic endocytic compartments. (E) Percentage of Zap70 or CD8 ectosomes also labelled with pZap70. Each data point represents a separate biological repeat (3-5 per marker) and includes data from > 1034 (CD3ε), 158 (CD3ζ), 152 (TCRβ), 180 (CD8), 492 (Zap70), 144 (DAG), 374 (PKCθ), 289 (Lck) and 114 (GrB) and 57 (pZap70) synapses labeled as indicated. Additional representative confocal images used in quantitation are provided in figures S3, S5 and S6.. Error bars show mean values ± SD from 3-5 independent experiments.

