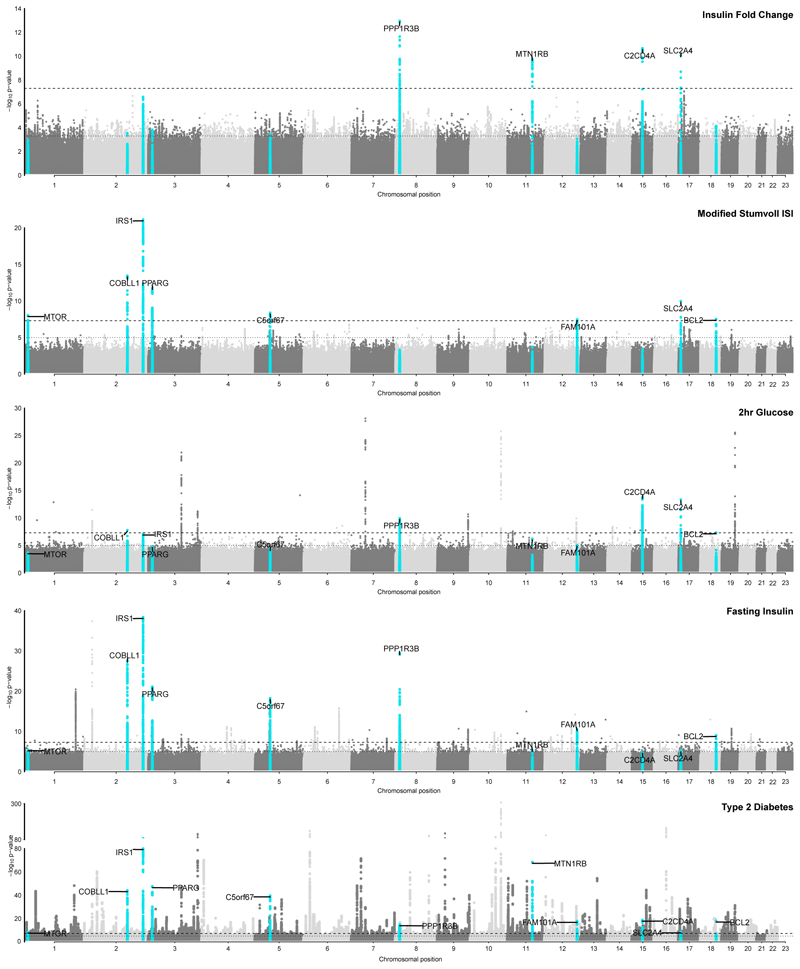
Figure 1. Loci associated with post-challenge insulin resistance overlap with associations with other glycaemic traits and T2D.
Manhattan plot of results for IFC, ISI and relative association with key glycaemic traits of interest. Y-axis denotes the -log10(p-value) of association for each trait. X-axis outlines the chromosomal position, with alternate chromosomes represented in light and dark grey. The dashed line defines genome-wide significance threshold (P = 5x10⁻⁸), and the dotted line denotes P = 1x10⁻⁵. Points highlighted in blue on each plot represent those that meet genome-wide significance for either IFC and ISI (P < 5x10⁻⁸). Labels for indicate the nearest gene at a locus defined at genome-wide significance for either IFC and ISI, and their relative association with other traits. Published GWAS were used for fasting insulin and 2 h glucose3,, and T2D26. For T2D y axis is cut at 1x10-80 for clarity, with the minimum p value truncated to P = 1x10-300. Uncorrected p-values are shown. All GWAS are in cohorts of European ancestry and adjusted for BMI, except T2D which is unadjusted for BMI.

