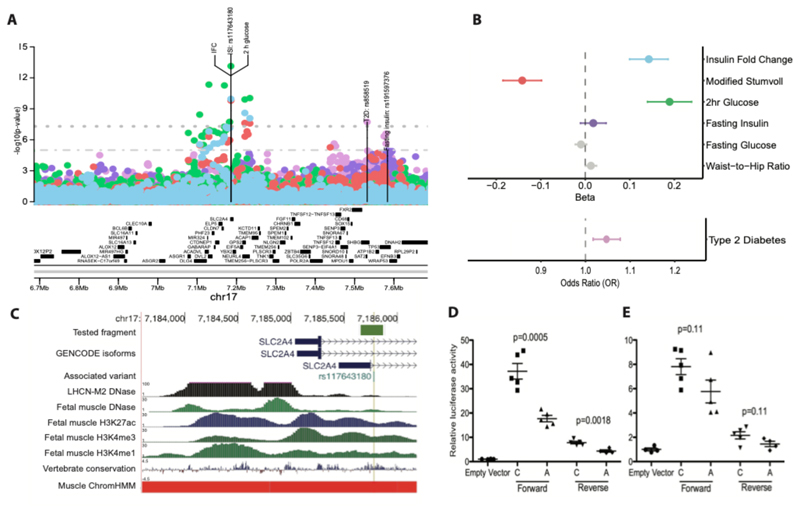
Figure 2. rs117643180 at SLC2A4 affects GLUT4 expression and transcription regulation.
A) Regional association plot showing ± 500kb around rs117643180 (SLC2A4) : insulin fold change (IFC) - blue, Modified Stumvoll (ISI) – red, and 2 h glucose3 – green, fasting insulin3 – purple, type 2 diabetes26 – pink. Y-axis denotes the unadjusted log10(p-value) of association. The dashed lines and dotted line indicate genome-wide (P = 5x10⁻⁸) and suggestive (P = 1x10⁻⁵) significance threshold, respectively. All association statistics are from BMI adjusted analyses in studies of European ancestry, except T2D which is unadjusted for BMI. Labels indicate the lead variant for each trait, with location indicating position. B) Association of rs117643180 with key metabolic traits of interest. Plot shows beta estimate or odds ratio of association for rs117643180 with traits outlined in (A) and fasting glucose3 and waist-to-hip ratio53 in grey. Point represents effect size and error bars indicate 95% CI. C) rs117643180 overlaps a transcriptionally active region in muscle tissues. rs117643180 is located ~730 bp downstream of the main SLC2A4 transcription start site (TSS) and ~330 bp downstream of an alternate SLC2A4 TSS. A 229-bp region flanking the variant, as shown by the orange bar, overlaps with accessible chromatin in LHCN-M2 (DNAase)54, chromatin marks of regulatory activity in fetal muscle leg tissue 55, a region conserved across species (vertebrate conservation), and a skeletal muscle ChromHMM56 (red =ActiveTSS). Created using http://genome.ucsc.edu57 D-E) rs117643180 exhibits allelic differences in transcriptional activity. Values represent fold-change of firefly luciferase/Renilla activity normalized to empty pGL4.23 vector in C2C12 cells, for the A (effect) and C (non-effect) alleles clones in forward and reverse orientation (See Methods) (D) and LHCN-M2 myotubes (E). Error bars represent the SEM of 4 to 5 independent clones tested in duplicate wells; points represent individual biological replicates. P-values are calculated from two-sided t-tests.

