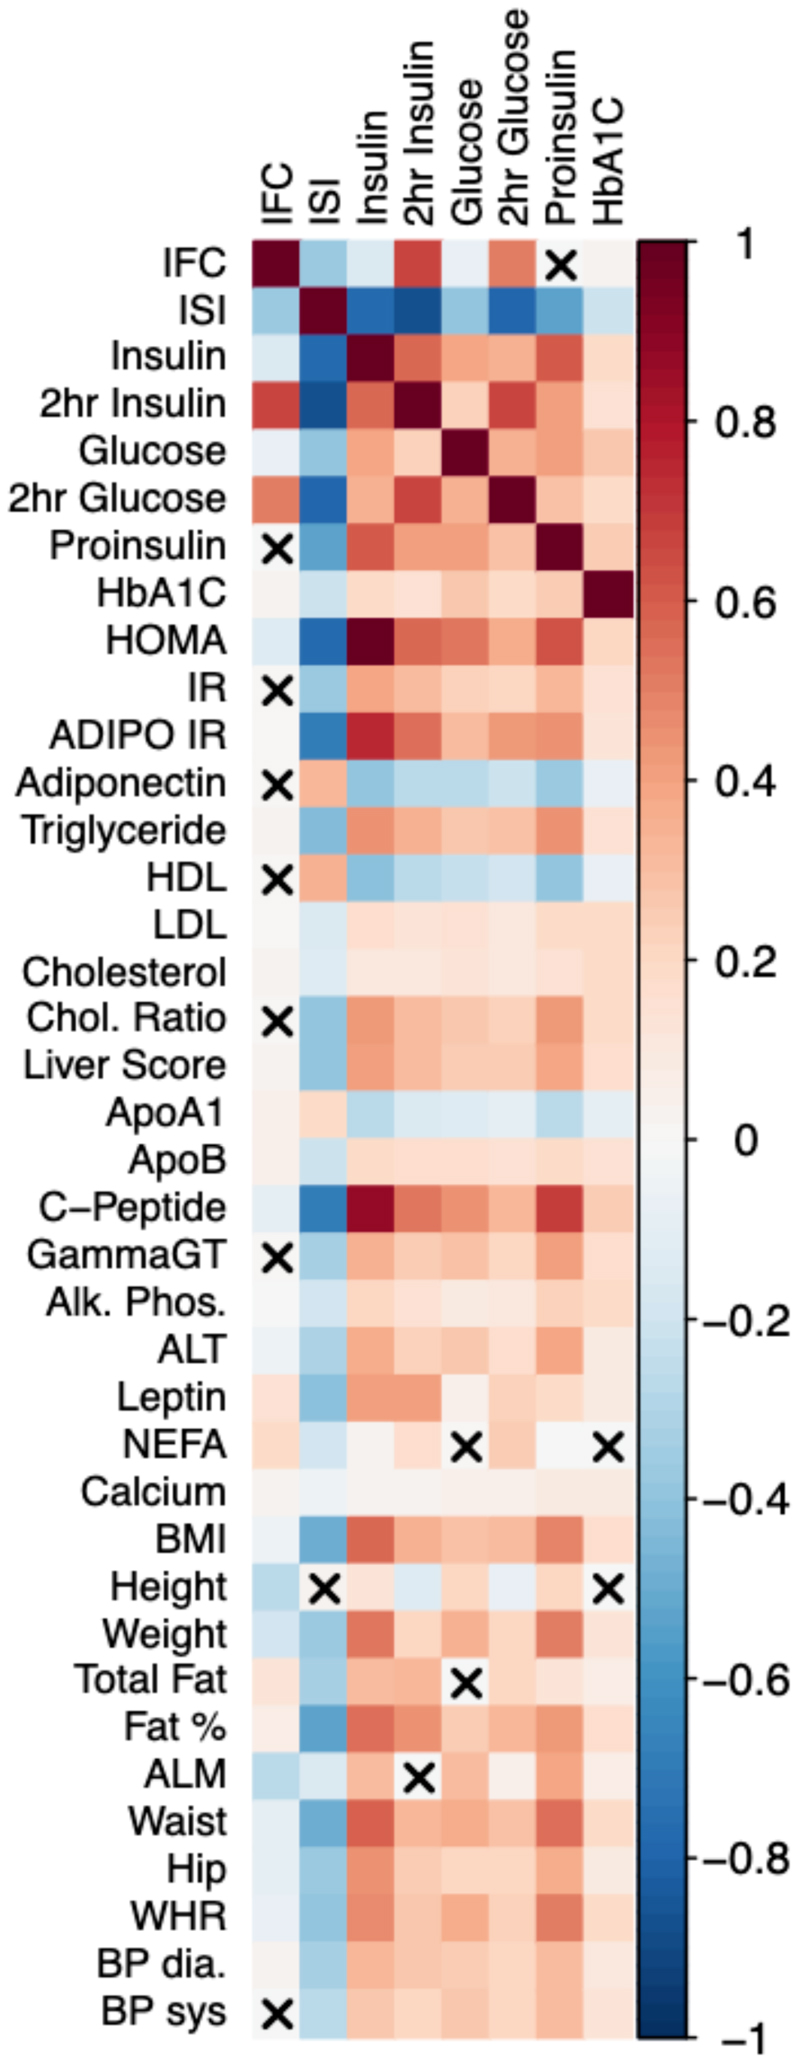
Extended Data Figure 2. Observational Correlation of Insulin Fold Change and Modified Stumvoll ISI with metabolic traits in the Fenland Study.
Pairwise Spearman’s Rank correlation. Red shades denote positive correlation, blue shared denote negative correlation between trait pairs. X denotes no significant correlation (P > 0.05).

