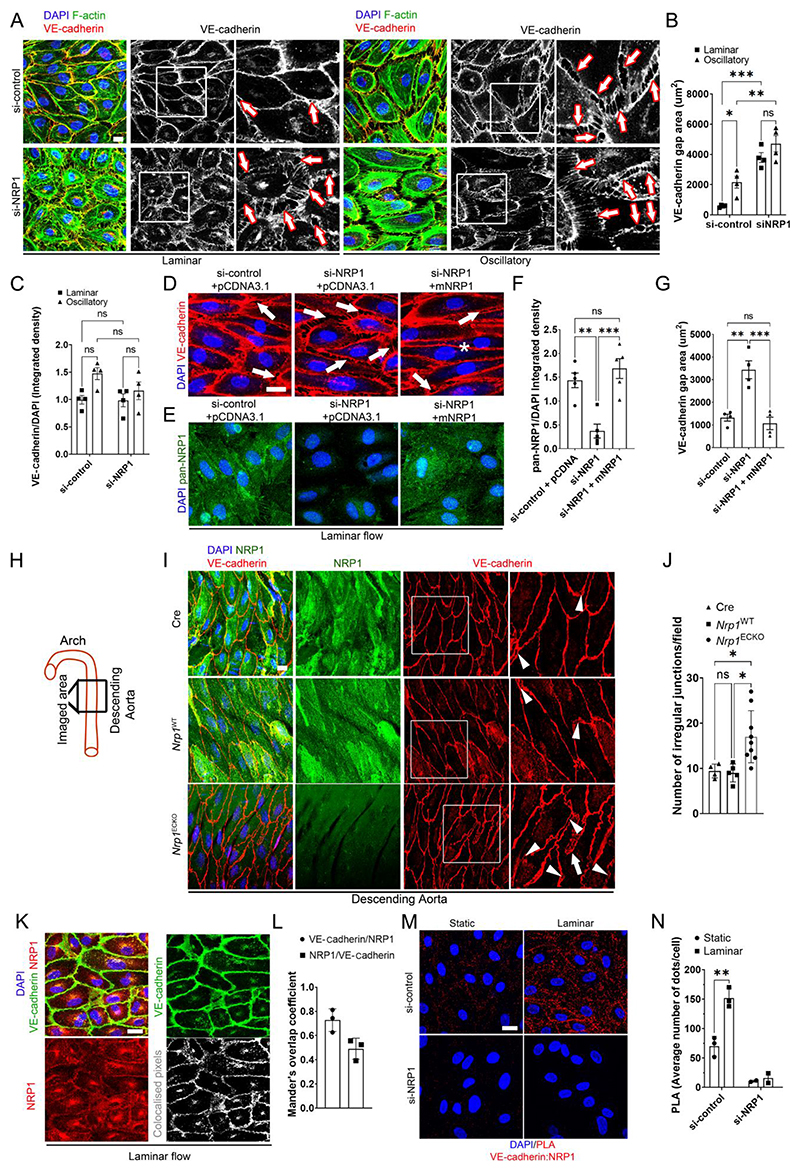
Fig. 2. NRP1 regulates adherence junctions by VE-cadherin.
(A) HUVECs transfected with si-control or si-NRP1 for 72 hours were exposed to laminar or oscillatory flow for 24 hours and stained for VE-cadherin (red and grey), F-actin (green) and DAPI (blue). Scale bar = 20 μm. White squares indicate the areas shown in higher magnification. Arrows indicate representative gaps between adjacent cells. (B) VE-cadherin staining gap (μm2) between neighboring cells measured in optical z-stacks. Data are presented as means ± SEM. N = 4 biological replicates per group. ns = non-significant, *p < 0.05, **p < 0.005, ***p < 0.001 by two-way ANOVA. (C) VE-cadherin integrated density measured in optical z-stacks normalized to DAPI. Data are presented as means ± SEM. N = 4 biological replicates per group. ns = non-significant by two-way ANOVA. (D and E) HUVECs transfected with si-control or si-NRP1 and pCDNA3.1 empty vector or pCDNA3.1 encoding WT mouse NRP1 for 72 hours and exposed to laminar flow for 24 hours were stained for VE-cadherin (red) (D) or with a pan-NRP1 antibody (green) (E) and counterstained with DAPI (blue). Scale bar = 20 μm. Arrows indicate representative gaps between adjacent cells. Asterisk indicates normal cellcell junction. (F) Quantification of NRP1 integrated density measured in optical z-stacks and normalized to DAPI. Data are presented as means ± SEM. N = 4 biological replicates per group. **p < 0.005, ***p < 0.001 by one-way ANOVA. (G) VE-cadherin gap (μm2) between adjacent cells measured in optical z-stacks Data are presented as means ± SEM. N = 4 biological replicates per group. **p < 0.005, ***p < 0.001 by one-way ANOVA. (H) Schematic indicating the aortic regions analyzed in (I) and (J). (I) C57BL/6 mice carrying two WT NRP1 alleles expressing Cdh5(PAC)-iCreERT2 (Cre), Nrp1fl/fl (Nrp1WT) or Nrp1fl/fl;Cdh5(PAC)-iCreERT2 (Nrp1ECKO) littermates injected daily with tamoxifen (12.5mg/kg) for 5 days at 4 weeks of age. Aortae were collected after 4 weeks and immunostained for NRP1 (green), VE-cadherin (red), DAPI (blue); Scale bar = 20 μm. White squares indicate the areas shown in higher magnification. White arrowheads indicate VE-cadherin discontinuous irregular patterns. White arrows show finger-like protrusions. (J) Number of irregular VE-cadherin junctions per field in optical z-stacks. Data are presented as means ± SD. N > 4 mice per group. *p < 0.05 by one-way ANOVA. (K) HUVECs subjected to laminar flow for 24 hours were stained for NRP1 (red), VE-cadherin (green) and DAPI (blue). Grey scale image represents NRP1/VE-cadherin co-localized pixels. Scale bar = 20 μm. (L) Mander’s coefficient of VE-cadherin and NRP1 colocalization. Data are presented as means ± SD. N = 3 biological replicates per group. (M) PLAs (red) for NRP1 and VE-cadherin in HUVECs transfected with si-control or si-NRP1 for 72 hours and subjected to static or laminar flow for 24 hours. Cells were counterstained with DAPI (blue). Scale bar = 20 μm. (N) Average PLA signal per cell measured in a minimum of 80 cells per experiment in 3 experiments for si-control and 2 experiments for si-NRP1. Data are presented as means ± SD. *p < 0.05 by paired t-test).

