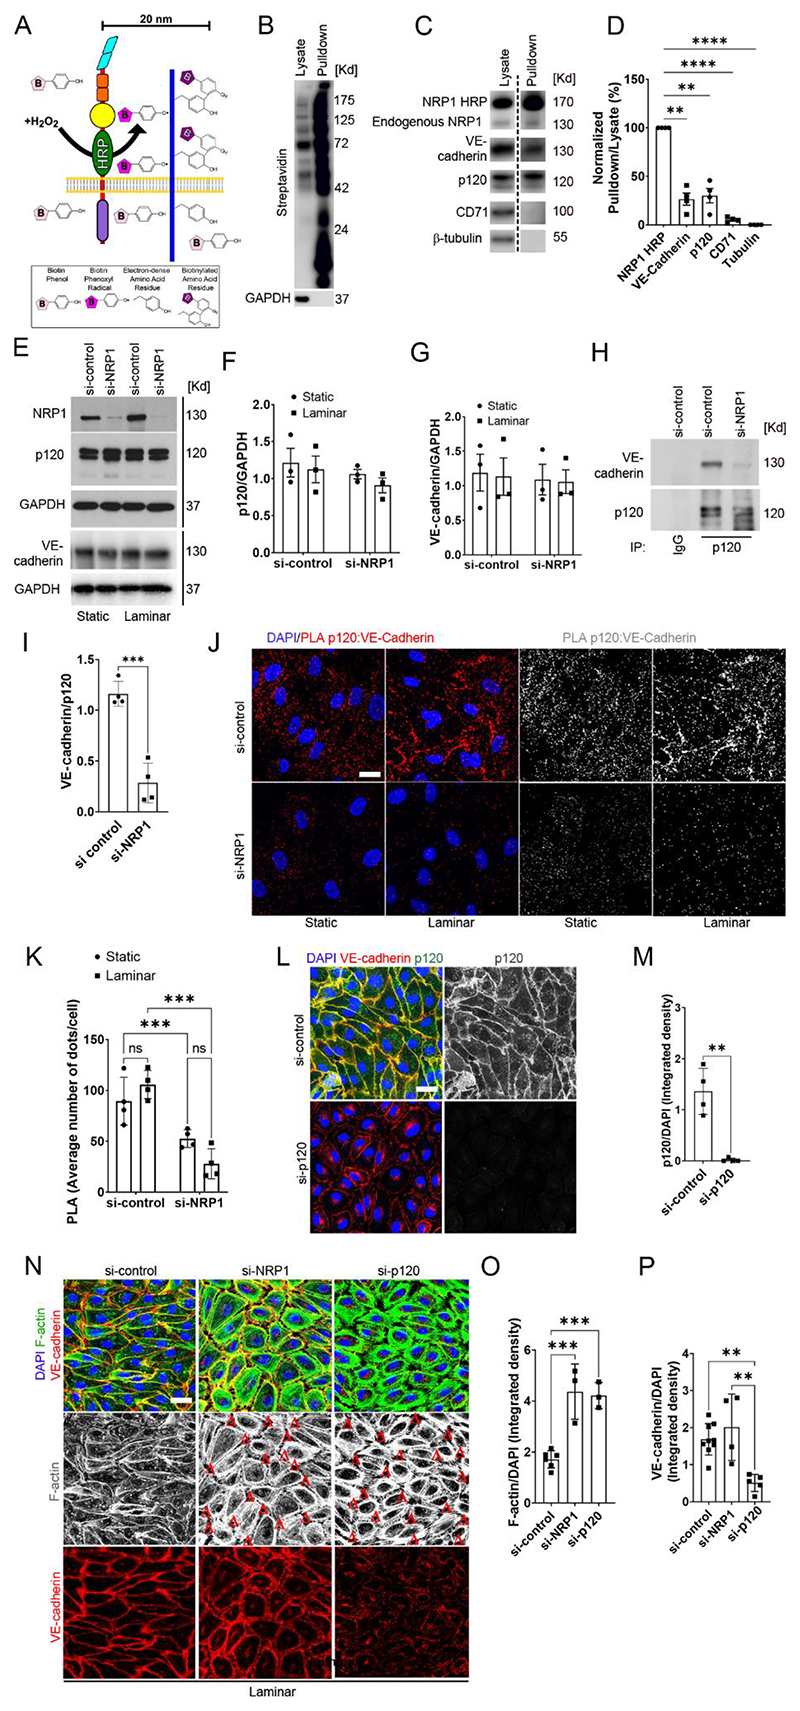
Fig. 3. Loss of NRP1 reduces the interaction between p120 catenin cadherin and VE-cadherin, resulting in adherens junction and cytoskeletal disruption.
A) Schematic illustrating the HRP–based proximity-labelling in which an HRP-containing protein exposed to hydrogen peroxide for 1 minute oxidizes fluid-phase–fed biotin tyramide, resulting in the biotinylation of proteins within a 20 nm radius. (B and C) Biotinylated proteins were pulled down from lysates with streptravidin beads, and pulldown samples and lysates were analysed by immunoblotting for the indicated proteins (dashed line indicates images are from different exposure times). (D) Quantification of pulled down proteins normalized to pulled down NRP1-HRP (100%) and tubulin (0%). Data are presented as means ± SEM. N = 4 biological replicates per group. **p<0.009; ****p<0.0001 by repeated measure one-way ANOVA with Dunnett post hoc test. (E to G) Representative immunoblotting (E) for NRP1, p120 catenin, VE-Cadherin and GAPDH in HUVECs transfected for 72 hours with si-control or si-NRP1 and exposed to laminar flow or static conditions for 24 hours. Densitometry analysis of p120 catenin (F) and VE-cadherin (G) relative to GAPDH. Data are presented as means ± SEM. N = 3 biological replicates per group. Two-way ANOVA. (H) Endogenous VE-cadherin and p120 catenin were co-immunoprecipitated from lysates of HUVECs cultured under static conditions and transfected with control or NRP1 siRNAs for 72 hours. p120 catenin or control IgG immunoprecipitates were immunoblotted for VE-cadherin and p120 catenin. (I) Densitometry analysis of endogenous co-immunoprecipitated VE-cadherin normalized to immunoprecipitated p120 catenin. Data are presented as means ± SEM. N = 4 biological replicates per group. ***p < 0.001 by paired t-test. (J) PLA (red, grey) for p120 catenin:VE-cadherin in HUVECs transfected with si-control or si-NRP1 for 72 hours, exposed to static or laminar flow conditions for 24 hours and counterstained with DAPI (blue). Scale bar = 20 μm. (K) Average PLA signal per cell was measured in a minimum of 80 cells per experiment from 4 independent experiments. Data are presented as means ± SD. **p < 0.001 by two-way ANOVA. (L) Staining for VE-cadherin (red), p120 catenin (green and gray) of HUVECs transfected for 72 hours with si-control or si-p120 catenin and exposed to laminar flow for 24 hours. Scale bar = 20 μm. (M) Quantification of p120 catenin integrated density in optical z-stacks normalized to DAPI. Data are presented as means ± SD. N = 4 biological replicates per group. **p < 0.001 by t-test. (N) HUVECs transfected for 72 hours with si-control, si-NRP1 or si-p120 catenin were subjected to laminar flow for 24 hours and stained for VE-cadherin (red), F-actin (green and grey) and DAPI (blue). Red Δs indicate gaps between adjacent cells. Scale bar = 20 μm. (O) Quantification of F-actin integrated density in optical z-stacks normalized to DAPI. Data are presented as means ± SD. N ≥ 3 biological replicates per group. ns = non-significant, ***p < 0.0001 by one-way ANOVA. (P) Quantification of VE-cadherin integrated density in optical z-stacks and normalized to DAPI. Data are presented as means ± SD. N ≥ 4 biological replicates per group. ns = non-significant, **p < 0.005 by one-way ANOVA.

