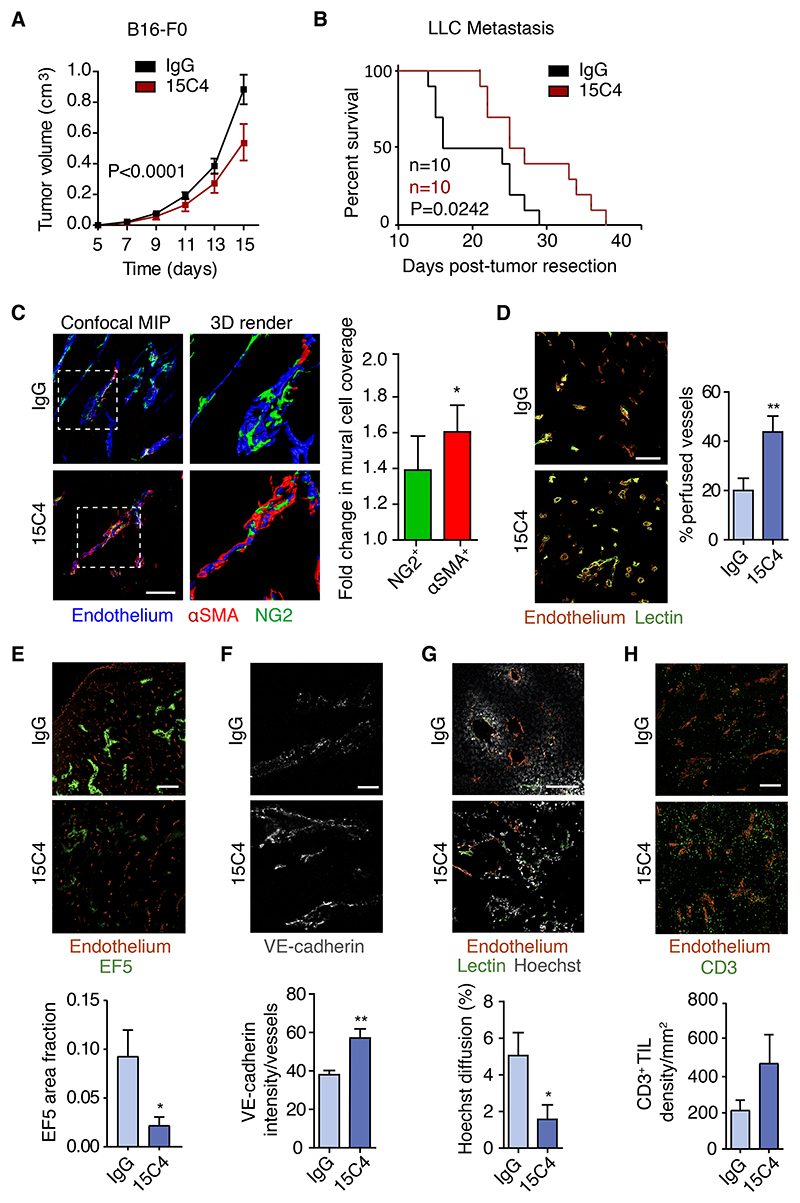
Figure 4. Antibody inhibition of LRG1 inhibits primary B16-F0 tumor growth, enhances survival in metastatic cancer, and normalizes tumor vasculature.
(A) Mean tumor volumes of B16-F0 tumors from wild-type mice treated with anti-LRG1 (15C4) or control antibody (IgG) (mean ± 95% CI). IgG, n = 35 mice; 15C4, n = 39 mice. Two-way repeated measures ANOVA.
(B) Kaplan-Meier curve showing overall survival of mice after primary subcutaneous LLC tumor resection when treated with control IgG or 15C4 in perioperative setting (n = 10 mice per group; 50 mg/kg twice per week). Mice with primary tumor regrowth were excluded from the analysis. Mantel-Cox test.
(C) Immunohistochemistry and quantification of mural cell (NG2 and a-SMA) association with B16-F0 tumor endothelium (CD31 or podocalyxin) from wild-type mice treated with anti-LRG1 (15C4) or control antibody (IgG). Scale bar, 100 μm. 3D renders of the highlighted areas are shown. Graph shows fold change (mean ± SEM) in mural cell overlap. For NG2, IgG n = 11, 15C4 n = 12. For α -SMA, IgG n = 16, 15C4 n = 19 tumors. Student’s t test. *p < 0.05.
(D–H) Immunohistochemistry and quantification of (D) tumor vessel perfusion (lectin; n = 12 tumors per condition; scale bar, 200 μm), (E) hypoxia (EF5; IgG, n = 7; 15C4, n = 5 tumors; scale bar, 1 mm), (F) adherens junction molecule (VE-cadherin; n = 5 tumors per condition; scale bar, 50 μm), (G) permeability (Hoechst; IgG, n = 11; 15C4, n = 10 tumors; scale bar, 200 μm), and (H) tumor-infiltrated lymphocyte density (CD3+ lymphocytes; IgG, n = 13; 15C4, n = 11 tumors; scale bar, 250 μm).
For all graphs, means ± SEMs; Student’s t test, *p < 0.05, **p < 0.01.

