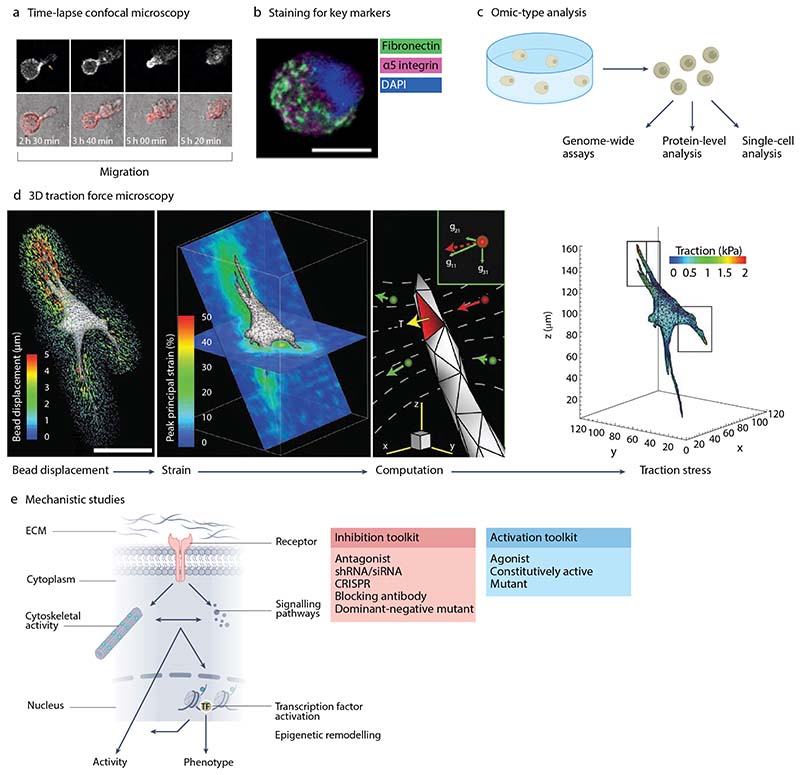
Figure 4. Analysis of cells in hydrogels.
a) Time series of images of a cancer cell migrating in a hydrogel using time-lapse confocal microscopy. Top row shows images of RFP-LifeAct whereas bottom row combines brightfield and actin imaging. b, Human mesenchymal stem cell (hMSC) encapsulated in a hydrogel. Immunostaining for fibronectin, α5 integrin, and DAPI. Scale bar = 10µm. c) Omics-type analyses can be used to assess gene expression, chromatin accessibility, protein levels and phosphorylation, and single-cell characteristics. d) Pipeline for determining traction forces generated by cells within a hydrogel from bead displacements. Scale bar = 50µm. e) Mechanotransduction pathways typically involve activation of a membrane receptor, which causes subsequent cytoskeletal activity and signaling pathway activation, impacting epigenetic remodelling and transcription factor activation, together regulating cell activity and phenotype. Specific molecules can be inhibited or activated to assess their role in cell behaviour. Part a is adapted from ref81, CC BY 4.0 (https://creativecommons.org/licenses/by/4.0/). Part b is adapted from ref109, CC BY 4.0 (https://creativecommons.org/licenses/by/4.0/). Part c is adapted from ref138. Part d is adapted from ref103, Springer Nature Limited.

